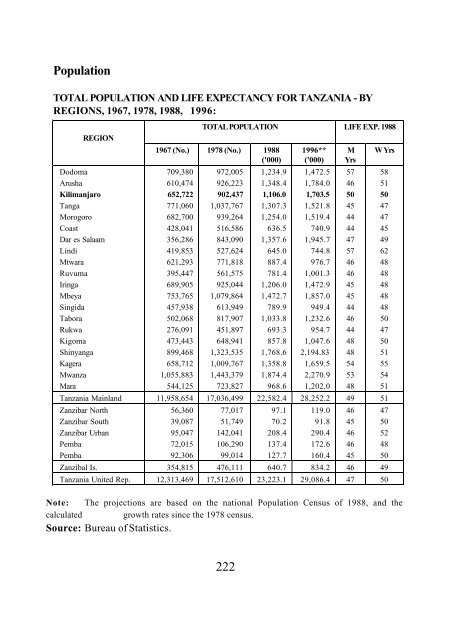
Population TOTAL POPULATION AND LIFE EXPECTANCY FOR TANZANIA - BY REGIONS, 1967, 1978, 1988, 1996: REGION Dodoma Arusha <strong>Kilimanjaro</strong> Tanga Morogoro Coast Dar es Salaam Lindi Mtwara Ruvuma Iringa Mbeya Singida Tabora Rukwa Kigoma Shinyanga Kagera Mwanza Mara TOTAL POPULATION LIFE EXP. 1988 1967 (No.) 1978 (No.) 1988 ('000) 709,380 610,474 652,722 771,060 682,700 428,041 356,286 419,853 621,293 395,447 689,905 753,765 457,938 502,068 276,091 473,443 899,468 658,712 1,055,883 544,125 972,005 926,223 902,437 1,037,767 939,264 516,586 843,090 527,624 771,818 561,575 925,044 1,079,864 613,949 817,907 451,897 648,941 1,323,535 1,009,767 1,443,379 723,827 1,234.9 1,348.4 1,106.0 1,307.3 1,254.0 636.5 1,357.6 645.0 887.4 781.4 1,206.0 1,472.7 789.9 1,033.8 693.3 857.8 1,768.6 1,358.8 1,874.4 968.6 1996** ('000) 1,472.5 1,784.0 1,703.5 1,521.8 1,519.4 740.9 1,945.7 744.8 976.7 1,001.3 1,472.9 1,857.0 949.4 1,232.6 954.7 1,047.6 2,194.83 1,659.5 2,270.9 1,202.0 <strong>Tanzania</strong> Mainland 11,958,654 17,036,499 22,582.4 28,252.2 49 51 Zanzibar North Zanzibar South Zanzibar Urban Pemba Pemba 56,360 39,087 95,047 72,015 92,306 77,017 51,749 142,041 106,290 99,014 97.1 70.2 208.4 137.4 127.7 119.0 91.8 290.4 172.6 160.4 Zanzibal Is. 354,815 476,111 640.7 834.2 46 49 <strong>Tanzania</strong> United Rep. 12,313,469 17,512,610 23,223.1 29,086.4 47 50 M Yrs 57 46 50 45 44 44 47 57 46 46 45 45 44 46 44 48 48 54 53 48 46 45 46 46 45 W Yrs Note: The projections are based on the national Population Census of 1988, and the calculated growth rates since the 1978 census. Source: Bureau of Statistics. 58 51 50 47 47 45 49 62 48 48 48 48 48 50 47 50 51 55 54 51 47 50 52 48 50 222
Land Use (Ha (millions) Proportion (Percentage) Small holder cultivation 4.1 5 Large scale agriculture 1.1 1 Grazing Land 35.0 39 Forest and Wood Lands 44.0 50 Other Lands 4.4 5 Total 88.6 100 Arable Land: Arable Land (Ha) 3,634,000 Lakes Victoria Tanganyika Nyasa Rukwa Eyasi Natron Manyara 34,850 sq km 13,350 sq km 5,600 sq km 2,850 sq km 1,050 sq km 900 sq km 320 sq km Mountain summits (metres above sea level) <strong>Kilimanjaro</strong> 5,895 Meru 4,566 223
- Page 2 and 3:
TABLE OF CONTENTS Pages FOREWORD...
- Page 4 and 5:
4.3.8 Future Strategy:.............
- Page 6 and 7:
FOREWORD 1. As we approach the 21st
- Page 8 and 9:
December, 1998 vii
- Page 10 and 11:
Kilimanjaro region is divided into
- Page 12 and 13:
Wachagga was defeated and the Germa
- Page 14 and 15:
Fig. 2: Population Distribution by
- Page 16 and 17:
Fig. 3a: Population Census Results
- Page 18 and 19:
Total 23,170,993 19.8 26.2 32 Sourc
- Page 21 and 22:
Fig. 3c: Thousands 160 140 120 100
- Page 23 and 24:
TABLE V(c): POPULATION DISTRIBUTION
- Page 25 and 26:
Source: Population Census 1988, Kil
- Page 27 and 28:
Table VI: Lifetime Migration By Reg
- Page 29 and 30:
Mwanga 1143 16185 347 15338 33013 S
- Page 31 and 32:
The Kilimanjaro region comprised of
- Page 33:
Table VIII: SUMMARY OF AGRO-ECONOMI
- Page 36 and 37:
- Cultivation and housing is very d
- Page 38 and 39:
2.0 REGIONAL ECONOMY 2.1 Introducti
- Page 40 and 41:
Table IX: REGIONAL GDP AT CURRENT P
- Page 42 and 43:
Table X: Regional GDP and Contribut
- Page 45 and 46:
2.3 Socio-economic Indicators: Tabl
- Page 47 and 48:
eans and dairy cattle. The Wheat zo
- Page 49 and 50:
scape is generally very gentle exce
- Page 51 and 52:
Beans 31409 23667 11562 17503 22326
- Page 53 and 54:
is 90,929.0 Metric tons while the a
- Page 55 and 56:
Table XV(a): 14 percent. Table show
- Page 57 and 58:
TABLE XV(b): Region Kilimanja r o H
- Page 59 and 60:
2.4.1.10Irrigation: According to th
- Page 61 and 62:
TABLE XVII: DAM IRRIGATION WATER SO
- Page 63 and 64:
TABLE XVIII: LOWER MOSHI AND NDUNGU
- Page 65 and 66:
TABLE XXI: PESTICIDES MADE AVAILABL
- Page 67 and 68:
TABLE XXIII: In comparison with reg
- Page 69 and 70:
Thousands 500 400 300 200 100 0 198
- Page 71 and 72:
Source: Mpango wa Maendeleo wa Mwak
- Page 73 and 74:
The region has 24 Artificial Insemi
- Page 75 and 76:
1993/94 46 226 23 52333 9137 1734 1
- Page 77 and 78:
In addition to the above mentioned
- Page 79 and 80:
There are 19 operating government n
- Page 82 and 83:
2.4.3.3 Fishing: Fishing industry i
- Page 84 and 85:
12000 10000 8000 6000 4000 2000 0 1
- Page 86 and 87:
TABLE XXXV: BEE-KEEPING PRODUCTS AN
- Page 88 and 89:
Fig. 11: Production of Bee-wax and
- Page 90 and 91:
Milk Production - - - - 1 - Malt -
- Page 92 and 93:
SECTION III 3.0 ECONOMIC INFRASTRUC
- Page 95 and 96:
TABLE XL: District TOTAL ROAD MILAG
- Page 97 and 98:
In general, Kilimanjaro region has
- Page 99 and 100:
TABLE XLI: HOUSEHOLDS WITH ELECTRIC
- Page 101 and 102:
embarking on extensive afforestatio
- Page 103 and 104:
schools has the best proportion of
- Page 106 and 107:
TABLE XLIV: EXPANSION OF PRIMARY SC
- Page 108 and 109:
TABLE XLVII: ENROLMENT (THOUSANDS)
- Page 110 and 111:
Fig. 13: Total Enrolment in Public
- Page 112 and 113:
Fig. 14: Pupils Selected For Form I
- Page 114 and 115:
2500 2000 1500 1000 500 0 1991 1992
- Page 116 and 117:
Fig. 16: Reason for Drop-Outs in 19
- Page 118 and 119:
TABLE: LIII: DROP-OUTS FROM PRIMARY
- Page 120 and 121:
Rombo Buildings Required Actual Sho
- Page 122 and 123:
Fig. 18b: Situation of Staff houses
- Page 124 and 125:
116 Furnitures Required Actual S h
- Page 126 and 127:
35000 30000 25000 20000 15000 10000
- Page 128 and 129:
TABLE LVII (a) District TEACHERS ST
- Page 130 and 131:
district in 1997 may be attributed
- Page 132 and 133:
TABLE LXI: ENROLMENT IN PUBLIC AND
- Page 134 and 135:
The region’s enrolment sex ratio
- Page 136 and 137:
TABLE LXII: ILLITERATE ADULT POPULA
- Page 138 and 139:
TABLE LXIV: LITERACY RATES BY SEX F
- Page 140 and 141:
132
- Page 142 and 143:
TABLELXVI: COMMON DISEASES IN % IN
- Page 144 and 145:
The regional hospital forms the ape
- Page 146 and 147:
Rombo 198,50 99.3 1,300 0.7 - - Mos
- Page 148 and 149:
Fig. 24: The Ratio of Population pe
- Page 150 and 151:
(c) Hospital Services: TABLE LXXI:
- Page 152 and 153:
may be attributed to the regions so
- Page 154 and 155:
MAINLAN D 44 50 49 51 Source: Healt
- Page 156 and 157:
(c) Maternal Mortality: Maternal Mo
- Page 158 and 159:
One to reduce MMR is to ensure that
- Page 160 and 161:
TABLE LXXVa: CUMMULATIVE AIDS CASES
- Page 162 and 163:
TABLE LXXVI: from these sources. So
- Page 164 and 165:
Moshi Urban Moshi Rural Rombo Mwang
- Page 166 and 167:
TABLE LXXX: not functioning. Tables
- Page 168 and 169:
The region has shortage of working
- Page 170 and 171:
TABLE LIII: TECHNOLOGICAL MIX ADOPT
- Page 172 and 173:
TABLE LXXXIII(a): Urban Centres STA
- Page 174 and 175:
SECTION V 5.0 OTHER DEVELOPMENT ISS
- Page 176 and 177:
Source: Kilimanjaro Regional Commun
- Page 178 and 179:
(b) Moshi urban District Project/Ac
- Page 180 and 181: 15,387 under 7 years children. The
- Page 182 and 183: 5.3 Programmes and Various Activiti
- Page 184 and 185: 13. UNDP Household Grain Storage De
- Page 186 and 187: 20. Water Aid Construction of water
- Page 188 and 189: There are about 52,000 heactares of
- Page 190 and 191: • The Rare Forest in Kilimanjaro;
- Page 192 and 193: ANNEX A KILIMANJARO REGION IN A NUT
- Page 194 and 195: Operating Centres - 8 Dips - 56 Aba
- Page 196 and 197: Regional GDP Per Capita at Curretnt
- Page 198 and 199: Hospitals 16 5 11 Health Centres 18
- Page 200 and 201: Total 266 ANNEX B HAI DISTRICT 1.0
- Page 202 and 203: - Classrooms - 806 - Shortage of cl
- Page 204 and 205: ANNEX C MWANGA DISTRICT 1.0 GENERAL
- Page 206 and 207: 2.0 ECONOMIC ACTIVITIES: - Agricult
- Page 208 and 209: Government - 7 Private - 13 3.2 Hea
- Page 210 and 211: 2.0 ECONOMIC ACTIVITIES - Majority
- Page 212 and 213: Rural Health Centres - 3 Dispensari
- Page 214 and 215: ANNEX E ROMBO DISTRICT 1.0 GENERAL:
- Page 216 and 217: - Number of Schools - 122 - Number
- Page 218 and 219: 3.3 Water: - Population (Rural) cov
- Page 220 and 221: Temperature - 15 0 C - 25 0 C 2.0 E
- Page 222 and 223: Hospitals - 4 Rural Health Centres
- Page 224 and 225: MOSHI URBAN DISTRICT 1.0 GENERAL: A
- Page 226 and 227: 2.0 ECONOMIC ACTIVITIES: - Wage emp
- Page 228 and 229: Tarmac roads - 60 kms Earth roads -
- Page 232 and 233: Climate (a) Rainfall Main rain seas
- Page 234 and 235: 1.3 NATIONAL PARKS National Parks (
- Page 236 and 237: (vi)MIKUMI NATIONAL PARK LOCATION:
- Page 238: (xi) GOMBE NATIONAL PARK LOCATION: