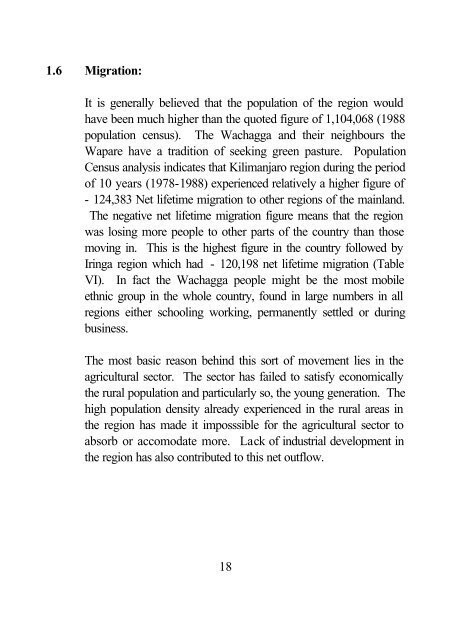
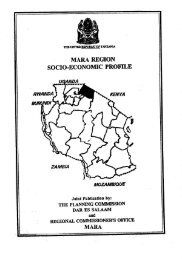
1.6 Migration: It is generally believed that the population of the region would have been much higher than the quoted figure of 1,104,068 (1988 population census). The Wachagga and their neighbours the Wapare have a tradition of seeking green pasture. Population Census analysis indicates that <strong>Kilimanjaro</strong> region during the period of 10 years (1978-1988) experienced relatively a higher figure of - 124,383 Net lifetime migration to other regions of the mainland. The negative net lifetime migration figure means that the region was losing more people to other parts of the country than those moving in. This is the highest figure in the country followed by Iringa region which had - 120,198 net lifetime migration (Table VI). In fact the Wachagga people might be the most mobile ethnic group in the whole country, found in large numbers in all regions either schooling working, permanently settled or during business. The most basic reason behind this sort of movement lies in the agricultural sector. The sector has failed to satisfy economically the rural population and particularly so, the young generation. The high population density already experienced in the rural areas in the region has made it imposssible for the agricultural sector to absorb or accomodate more. Lack of industrial development in the region has also contributed to this net outflow. 18
Table VI: Lifetime Migration By Region, <strong>Tanzania</strong> (1988 - Census) Region Lifetime in Migration Lifetime out Migration Net Lifetime Migration Gross Migration Lindi 95,200 145,031 -9,831 240,231 Arusha 218,427 76,703 141,724 295,130 <strong>Kilimanjaro</strong> 93,040 217,423 -124,383 310,463 Tanga 98,747 150,915 -52,168 249,662 Morogoro 172,393 141,956 30,437 314,349 Coast 103,804 207,716 -103,912 311,520 Dar es Salaam 651,246 150,625 500,621 801,871 Dodoma 89,900 190,985 -101,085 280,885 Mtwara 46,299 144,988 -98,689 191,287 Ruvuma 66,442 81,661 -15,219 148,103 Iringa 49,282 169,480 -120,198 218,762 Mbeya 160,377 113,378 46,999 273,755 Singida 86,651 150,531 -63,880 237,182 Tabora 241,729 175,359 66,370 417,088 Rukwa 87,599 49,294 38,305 136,893 Kigoma 26,795 129,718 -102,923 156,513 Shinyanga 288,210 281,447 6,763 569,657 Kagera 103,713 109,693 -5,980 213,406 Mwanza 270,142 303,646 -33,504 573,788 Mara 75,987 115,865 -39,878 191,852 Total 3,025,983 3,106,414 -80,431 6,132,397 Source: 1988 Population Census, National Profile, analytical Report 19
- Page 2 and 3: TABLE OF CONTENTS Pages FOREWORD...
- Page 4 and 5: 4.3.8 Future Strategy:.............
- Page 6 and 7: FOREWORD 1. As we approach the 21st
- Page 8 and 9: December, 1998 vii
- Page 10 and 11: Kilimanjaro region is divided into
- Page 12 and 13: Wachagga was defeated and the Germa
- Page 14 and 15: Fig. 2: Population Distribution by
- Page 16 and 17: Fig. 3a: Population Census Results
- Page 18 and 19: Total 23,170,993 19.8 26.2 32 Sourc
- Page 21 and 22: Fig. 3c: Thousands 160 140 120 100
- Page 23 and 24: TABLE V(c): POPULATION DISTRIBUTION
- Page 25: Source: Population Census 1988, Kil
- Page 29 and 30: Mwanga 1143 16185 347 15338 33013 S
- Page 31 and 32: The Kilimanjaro region comprised of
- Page 33: Table VIII: SUMMARY OF AGRO-ECONOMI
- Page 36 and 37: - Cultivation and housing is very d
- Page 38 and 39: 2.0 REGIONAL ECONOMY 2.1 Introducti
- Page 40 and 41: Table IX: REGIONAL GDP AT CURRENT P
- Page 42 and 43: Table X: Regional GDP and Contribut
- Page 45 and 46: 2.3 Socio-economic Indicators: Tabl
- Page 47 and 48: eans and dairy cattle. The Wheat zo
- Page 49 and 50: scape is generally very gentle exce
- Page 51 and 52: Beans 31409 23667 11562 17503 22326
- Page 53 and 54: is 90,929.0 Metric tons while the a
- Page 55 and 56: Table XV(a): 14 percent. Table show
- Page 57 and 58: TABLE XV(b): Region Kilimanja r o H
- Page 59 and 60: 2.4.1.10Irrigation: According to th
- Page 61 and 62: TABLE XVII: DAM IRRIGATION WATER SO
- Page 63 and 64: TABLE XVIII: LOWER MOSHI AND NDUNGU
- Page 65 and 66: TABLE XXI: PESTICIDES MADE AVAILABL
- Page 67 and 68: TABLE XXIII: In comparison with reg
- Page 69 and 70: Thousands 500 400 300 200 100 0 198
- Page 71 and 72: Source: Mpango wa Maendeleo wa Mwak
- Page 73 and 74: The region has 24 Artificial Insemi
- Page 75 and 76: 1993/94 46 226 23 52333 9137 1734 1
- Page 77 and 78:
In addition to the above mentioned
- Page 79 and 80:
There are 19 operating government n
- Page 82 and 83:
2.4.3.3 Fishing: Fishing industry i
- Page 84 and 85:
12000 10000 8000 6000 4000 2000 0 1
- Page 86 and 87:
TABLE XXXV: BEE-KEEPING PRODUCTS AN
- Page 88 and 89:
Fig. 11: Production of Bee-wax and
- Page 90 and 91:
Milk Production - - - - 1 - Malt -
- Page 92 and 93:
SECTION III 3.0 ECONOMIC INFRASTRUC
- Page 95 and 96:
TABLE XL: District TOTAL ROAD MILAG
- Page 97 and 98:
In general, Kilimanjaro region has
- Page 99 and 100:
TABLE XLI: HOUSEHOLDS WITH ELECTRIC
- Page 101 and 102:
embarking on extensive afforestatio
- Page 103 and 104:
schools has the best proportion of
- Page 106 and 107:
TABLE XLIV: EXPANSION OF PRIMARY SC
- Page 108 and 109:
TABLE XLVII: ENROLMENT (THOUSANDS)
- Page 110 and 111:
Fig. 13: Total Enrolment in Public
- Page 112 and 113:
Fig. 14: Pupils Selected For Form I
- Page 114 and 115:
2500 2000 1500 1000 500 0 1991 1992
- Page 116 and 117:
Fig. 16: Reason for Drop-Outs in 19
- Page 118 and 119:
TABLE: LIII: DROP-OUTS FROM PRIMARY
- Page 120 and 121:
Rombo Buildings Required Actual Sho
- Page 122 and 123:
Fig. 18b: Situation of Staff houses
- Page 124 and 125:
116 Furnitures Required Actual S h
- Page 126 and 127:
35000 30000 25000 20000 15000 10000
- Page 128 and 129:
TABLE LVII (a) District TEACHERS ST
- Page 130 and 131:
district in 1997 may be attributed
- Page 132 and 133:
TABLE LXI: ENROLMENT IN PUBLIC AND
- Page 134 and 135:
The region’s enrolment sex ratio
- Page 136 and 137:
TABLE LXII: ILLITERATE ADULT POPULA
- Page 138 and 139:
TABLE LXIV: LITERACY RATES BY SEX F
- Page 140 and 141:
132
- Page 142 and 143:
TABLELXVI: COMMON DISEASES IN % IN
- Page 144 and 145:
The regional hospital forms the ape
- Page 146 and 147:
Rombo 198,50 99.3 1,300 0.7 - - Mos
- Page 148 and 149:
Fig. 24: The Ratio of Population pe
- Page 150 and 151:
(c) Hospital Services: TABLE LXXI:
- Page 152 and 153:
may be attributed to the regions so
- Page 154 and 155:
MAINLAN D 44 50 49 51 Source: Healt
- Page 156 and 157:
(c) Maternal Mortality: Maternal Mo
- Page 158 and 159:
One to reduce MMR is to ensure that
- Page 160 and 161:
TABLE LXXVa: CUMMULATIVE AIDS CASES
- Page 162 and 163:
TABLE LXXVI: from these sources. So
- Page 164 and 165:
Moshi Urban Moshi Rural Rombo Mwang
- Page 166 and 167:
TABLE LXXX: not functioning. Tables
- Page 168 and 169:
The region has shortage of working
- Page 170 and 171:
TABLE LIII: TECHNOLOGICAL MIX ADOPT
- Page 172 and 173:
TABLE LXXXIII(a): Urban Centres STA
- Page 174 and 175:
SECTION V 5.0 OTHER DEVELOPMENT ISS
- Page 176 and 177:
Source: Kilimanjaro Regional Commun
- Page 178 and 179:
(b) Moshi urban District Project/Ac
- Page 180 and 181:
15,387 under 7 years children. The
- Page 182 and 183:
5.3 Programmes and Various Activiti
- Page 184 and 185:
13. UNDP Household Grain Storage De
- Page 186 and 187:
20. Water Aid Construction of water
- Page 188 and 189:
There are about 52,000 heactares of
- Page 190 and 191:
• The Rare Forest in Kilimanjaro;
- Page 192 and 193:
ANNEX A KILIMANJARO REGION IN A NUT
- Page 194 and 195:
Operating Centres - 8 Dips - 56 Aba
- Page 196 and 197:
Regional GDP Per Capita at Curretnt
- Page 198 and 199:
Hospitals 16 5 11 Health Centres 18
- Page 200 and 201:
Total 266 ANNEX B HAI DISTRICT 1.0
- Page 202 and 203:
- Classrooms - 806 - Shortage of cl
- Page 204 and 205:
ANNEX C MWANGA DISTRICT 1.0 GENERAL
- Page 206 and 207:
2.0 ECONOMIC ACTIVITIES: - Agricult
- Page 208 and 209:
Government - 7 Private - 13 3.2 Hea
- Page 210 and 211:
2.0 ECONOMIC ACTIVITIES - Majority
- Page 212 and 213:
Rural Health Centres - 3 Dispensari
- Page 214 and 215:
ANNEX E ROMBO DISTRICT 1.0 GENERAL:
- Page 216 and 217:
- Number of Schools - 122 - Number
- Page 218 and 219:
3.3 Water: - Population (Rural) cov
- Page 220 and 221:
Temperature - 15 0 C - 25 0 C 2.0 E
- Page 222 and 223:
Hospitals - 4 Rural Health Centres
- Page 224 and 225:
MOSHI URBAN DISTRICT 1.0 GENERAL: A
- Page 226 and 227:
2.0 ECONOMIC ACTIVITIES: - Wage emp
- Page 228 and 229:
Tarmac roads - 60 kms Earth roads -
- Page 230 and 231:
Population TOTAL POPULATION AND LIF
- Page 232 and 233:
Climate (a) Rainfall Main rain seas
- Page 234 and 235:
1.3 NATIONAL PARKS National Parks (
- Page 236 and 237:
(vi)MIKUMI NATIONAL PARK LOCATION:
- Page 238:
(xi) GOMBE NATIONAL PARK LOCATION: