PERÃ - Observatory for Renewable Energy in Latin America and
PERÃ - Observatory for Renewable Energy in Latin America and
PERÃ - Observatory for Renewable Energy in Latin America and

Create successful ePaper yourself
Turn your PDF publications into a flip-book with our unique Google optimized e-Paper software.
<br />
Perú- Products I <strong>and</strong> II<br />
<br />
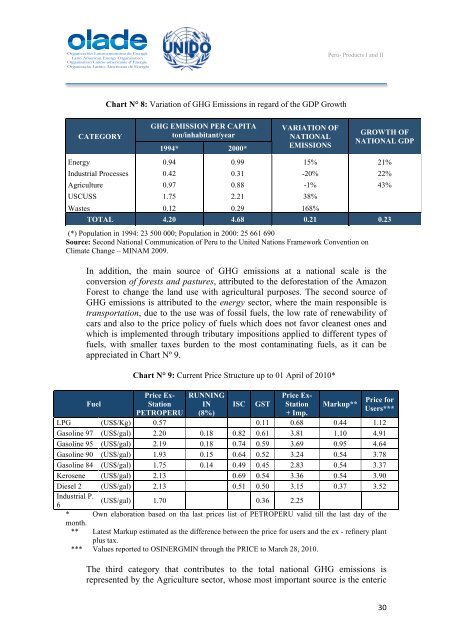
Chart N° 8: Variation of GHG Emissions <strong>in</strong> regard of the GDP Growth<br />
CATEGORY<br />
GHG EMISSION PER CAPITA<br />
ton/<strong>in</strong>habitant/year<br />
1994* 2000*<br />
VARIATION OF<br />
NATIONAL<br />
EMISSIONS<br />
GROWTH OF<br />
NATIONAL GDP<br />
<strong>Energy</strong> 0.94 0.99 15% 21%<br />
Industrial Processes 0.42 0.31 -20% 22%<br />
Agriculture 0.97 0.88 -1% 43%<br />
USCUSS 1.75 2.21 38%<br />
Wastes 0.12 0.29 168%<br />
TOTAL 4.20 4.68 0.21 0.23<br />
(*) Population <strong>in</strong> 1994: 23 500 000; Population <strong>in</strong> 2000: 25 661 690<br />
Source: Second National Communication of Peru to the United Nations Framework Convention on<br />
Climate Change – MINAM 2009.<br />
In addition, the ma<strong>in</strong> source of GHG emissions at a national scale is the<br />
conversion of <strong>for</strong>ests <strong>and</strong> pastures, attributed to the de<strong>for</strong>estation of the Amazon<br />
Forest to change the l<strong>and</strong> use with agricultural purposes. The second source of<br />
GHG emissions is attributed to the energy sector, where the ma<strong>in</strong> responsible is<br />
transportation, due to the use was of fossil fuels, the low rate of renewability of<br />
cars <strong>and</strong> also to the price policy of fuels which does not favor cleanest ones <strong>and</strong><br />
which is implemented through tributary impositions applied to different types of<br />
fuels, with smaller taxes burden to the most contam<strong>in</strong>at<strong>in</strong>g fuels, as it can be<br />
appreciated <strong>in</strong> Chart Nº 9.<br />
Fuel<br />
Chart N° 9: Current Price Structure up to 01 April of 2010*<br />
Price Ex-<br />
Station<br />
PETROPERU<br />
RUNNING<br />
IN<br />
(8%)<br />
ISC<br />
GST<br />
Price Ex-<br />
Station<br />
+ Imp.<br />
Markup**<br />
Price <strong>for</strong><br />
Users***<br />
LPG (US$/Kg) 0.57 0.11 0.68 0.44 1.12<br />
Gasol<strong>in</strong>e 97 (US$/gal) 2.20 0.18 0.82 0.61 3.81 1.10 4.91<br />
Gasol<strong>in</strong>e 95 (US$/gal) 2.19 0.18 0.74 0.59 3.69 0.95 4.64<br />
Gasol<strong>in</strong>e 90 (US$/gal) 1.93 0.15 0.64 0.52 3.24 0.54 3.78<br />
Gasol<strong>in</strong>e 84 (US$/gal) 1.75 0.14 0.49 0.45 2.83 0.54 3.37<br />
Kerosene (US$/gal) 2.13 0.69 0.54 3.36 0.54 3.90<br />
Diesel 2 (US$/gal) 2.13 0.51 0.50 3.15 0.37 3.52<br />
Industrial P.<br />
(US$/gal) 1.70 0.36 2.25<br />
6<br />
* Own elaboration based on tha last prices list of PETROPERU valid till the last day of the<br />
month.<br />
** Latest Markup estimated as the difference between the price <strong>for</strong> users <strong>and</strong> the ex - ref<strong>in</strong>ery plant<br />
plus tax.<br />
*** Values reported to OSINERGMIN through the PRICE to March 28, 2010.<br />
The third category that contributes to the total national GHG emissions is<br />
represented by the Agriculture sector, whose most important source is the enteric<br />
30