- Page 1:
INTEGRATION OF SOLID OXIDE FUEL CEL
- Page 5:
Abstract It is investigated whether
- Page 9:
Preface This report is documentatio
- Page 12 and 13:
CONTENTS Preface . . . . . . . . .
- Page 14 and 15:
CONTENTS 4.2.3 SOFC stack . . . . .
- Page 16 and 17:
CONTENTS A.4 DG appendix . . . . .
- Page 18 and 19:
LIST OF FIGURES 4.3 Diagram of sing
- Page 21 and 22:
NOMENCLATURE Acronyms Acronym ABS A
- Page 23 and 24:
Greek (and other) Symbols Greek (an
- Page 25:
Subscripts Subscripts Subscript 2P
- Page 28 and 29:
1. INTRODUCTION Chapter 4, System d
- Page 30 and 31:
1. INTRODUCTION the electricity and
- Page 32 and 33:
1. INTRODUCTION 1.4 SOFC The fuel c
- Page 34 and 35:
1. INTRODUCTION 1.5 Heat driven coo
- Page 36 and 37:
1. INTRODUCTION Cycle description.
- Page 38 and 39:
1. INTRODUCTION Ammonia-water The C
- Page 40 and 41:
1. INTRODUCTION 1.5.3 Platen Munter
- Page 42 and 43:
1. INTRODUCTION Open loop In an ope
- Page 44 and 45:
1. INTRODUCTION 1.7 Problem stateme
- Page 46 and 47:
2. MARKET INVESTIGATION appendix A.
- Page 48 and 49:
2. MARKET INVESTIGATION 2.2.2 Ship
- Page 50 and 51:
2. MARKET INVESTIGATION Pay Back Ti
- Page 52 and 53:
2. MARKET INVESTIGATION 2.3.2 Micro
- Page 54 and 55:
2. MARKET INVESTIGATION Sensitivity
- Page 56 and 57:
2. MARKET INVESTIGATION • ECH pri
- Page 58 and 59:
2. MARKET INVESTIGATION 2.4.3 Resul
- Page 60 and 61:
2. MARKET INVESTIGATION 16000 14000
- Page 62 and 63:
2. MARKET INVESTIGATION Annuity pri
- Page 64 and 65:
2. MARKET INVESTIGATION 2.4.4 Concl
- Page 67 and 68:
C H A P T E R 3 COMPONENT DESCRIPTI
- Page 69 and 70:
3.1. Introduction The seven stream
- Page 71 and 72:
3.2. Absorber - ABSO 3.2 Absorber -
- Page 73 and 74:
3.2. Absorber - ABSO implicitly thr
- Page 75 and 76:
3.4. Burner - BURN 3.4 Burner - BUR
- Page 77 and 78:
3.5. Condenser - COND T [° C ] ΔT
- Page 79 and 80:
3.6. Desorber - DES 3.6 Desorber -
- Page 81 and 82:
3.7. Evaporator - EVAP 3.7 Evaporat
- Page 83 and 84:
3.8. Heat Exchanger - HEX 3.8 Heat
- Page 85 and 86:
3.8. Heat Exchanger - HEX The press
- Page 87 and 88:
3.10. Pre Reformer - PR 3.10 Pre Re
- Page 89 and 90:
3.11. Pump - PUMP 3.11 Pump - PUMP
- Page 91 and 92:
3.12. Solid Oxide Fuel Cell - SOFC
- Page 93 and 94:
3.12. Solid Oxide Fuel Cell - SOFC
- Page 95 and 96:
3.12. Solid Oxide Fuel Cell - SOFC
- Page 97 and 98:
3.14 Cooling Tower - TOWER 3.14. Co
- Page 99 and 100:
3.14. Cooling Tower - TOWER tower d
- Page 101 and 102:
3.14. Cooling Tower - TOWER The air
- Page 103:
3.15. Expansion valve - VA/VB possi
- Page 106 and 107:
4. SYSTEM DESCRIPTION 8 SPG 10 20 1
- Page 108 and 109:
4. SYSTEM DESCRIPTION Pre reformer
- Page 110 and 111:
4. SYSTEM DESCRIPTION which increas
- Page 112 and 113:
4. SYSTEM DESCRIPTION 4.3 Absorptio
- Page 114 and 115:
4. SYSTEM DESCRIPTION 4.3.3 Pumping
- Page 116 and 117:
4. SYSTEM DESCRIPTION The temperatu
- Page 118 and 119:
4. SYSTEM DESCRIPTION 4.5 Absorptio
- Page 120 and 121:
4. SYSTEM DESCRIPTION 4.6 Cooling T
- Page 122 and 123: 4. SYSTEM DESCRIPTION (below 100
- Page 124 and 125: 4. SYSTEM DESCRIPTION as: Ẇ AC =
- Page 126 and 127: 4. SYSTEM DESCRIPTION 4.8 Verificat
- Page 128 and 129: 4. SYSTEM DESCRIPTION SOFC net effi
- Page 131 and 132: C H A P T E R 5 SIMULATION AND RESU
- Page 133 and 134: 5.1. Basic absorption cooling Figur
- Page 135 and 136: 5.1. Basic absorption cooling geous
- Page 137 and 138: 5.1.3 Changing evaporator temperatu
- Page 139 and 140: 5.1. Basic absorption cooling as de
- Page 141 and 142: 5.2. System configurations Red repr
- Page 143 and 144: 5.2. System configurations Dual Hea
- Page 145 and 146: 5.2. System configurations in a hot
- Page 147 and 148: 5.3. Partial optimization of standa
- Page 149 and 150: 5.3. Partial optimization of standa
- Page 151 and 152: 5.3. Partial optimization of standa
- Page 153 and 154: 5.3. Partial optimization of standa
- Page 155 and 156: Anode recycling (α SPG1 ) 5.3. Par
- Page 157 and 158: 5.3. Partial optimization of standa
- Page 159 and 160: 5.3. Partial optimization of standa
- Page 161 and 162: 5.3. Partial optimization of standa
- Page 163 and 164: 5.3. Partial optimization of standa
- Page 165 and 166: 5.3. Partial optimization of standa
- Page 167 and 168: 5.3. Partial optimization of standa
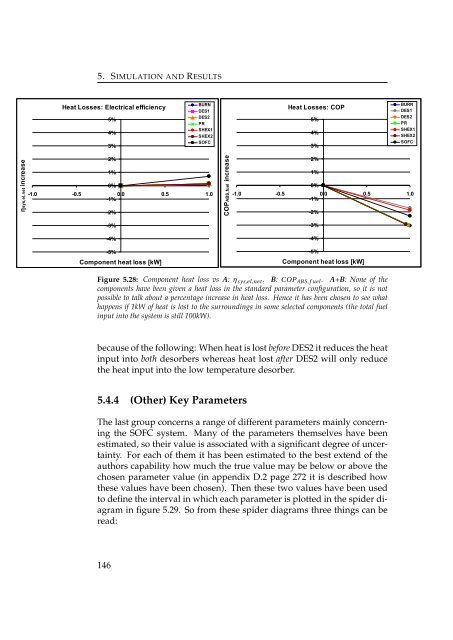
- Page 169 and 170: 5.4. Sensitivity Analysis ηsys,el,
- Page 171: 5.4. Sensitivity Analysis the press
- Page 175 and 176: 5.5 Total optimization of system 5.
- Page 177 and 178: 5.5. Total optimization of system i
- Page 179 and 180: 5.5. Total optimization of system e
- Page 181 and 182: C H A P T E R 6 CASES AND ECONOMICS
- Page 183 and 184: 6.2. High humidity climate BBC Home
- Page 185 and 186: 6.2. High humidity climate Figure 6
- Page 187 and 188: 6.3. Low humidity climate Figure 6.
- Page 189 and 190: 6.4. Economics 6.4 Economics When t
- Page 191 and 192: C H A P T E R 7 DISCUSSION In this
- Page 193 and 194: 7.1.1 Accuracy and sensitivity 7.1.
- Page 195 and 196: 7.2. Economical considerations Furt
- Page 197 and 198: 7.2.3 Distributed Generation (DG) D
- Page 199 and 200: 7.2. Economical considerations to 6
- Page 201 and 202: 7.2. Economical considerations As m
- Page 203 and 204: C H A P T E R 8 CONCLUSION System c
- Page 205 and 206: For the APU segment a SOFC-ABS syst
- Page 207 and 208: C H A P T E R 9 FURTHER WORK Some i
- Page 209 and 210: BIBLIOGRAPHY [1] Acfshop.dk: http:/
- Page 211 and 212: Bibliography [24] Nordea invest: ht
- Page 213: Appendices 187
- Page 216 and 217: A. MARKET INVESTIGATION A.1 Market
- Page 218 and 219: A. MARKET INVESTIGATION No cost for
- Page 220 and 221: Absorpton unit (free waste heat) Pr
- Page 222 and 223:
A. MARKET INVESTIGATION A.3 CHP app
- Page 224 and 225:
Absorption Refrigerator RGE 400 fro
- Page 226 and 227:
Sensitivity analysis The effect on
- Page 228 and 229:
A. MARKET INVESTIGATION A.4 DG appe
- Page 230 and 231:
From the "CHP in the Hotel and Casi
- Page 232 and 233:
Hotel with 230 rooms and 18000 m^2
- Page 234 and 235:
SOFC + Water Heating (no ABS), Cool
- Page 236 and 237:
16000 Pay Back Time: Entire System
- Page 238 and 239:
SOFC + Water Heating (no ABS), Cool
- Page 240 and 241:
Hot climate SOFC + ABS + HW vs pure
- Page 242 and 243:
Assumptions SOFC price = 2650kr/kW
- Page 244 and 245:
Hot climate Increase (Delta NPV_10)
- Page 246 and 247:
Prices of absorption cooling units
- Page 248 and 249:
1'000'000 900'000 800'000 143'600 7
- Page 250 and 251:
A. MARKET INVESTIGATION A.6 Gas and
- Page 252 and 253:
Retail electricity prices Exchange
- Page 254 and 255:
B. DIAGRAMS AND PLOTS B.1 GAX diagr
- Page 256 and 257:
B. DIAGRAMS AND PLOTS B.3 Closed ad
- Page 258 and 259:
B. DIAGRAMS AND PLOTS B.4.2 p-T dia
- Page 260 and 261:
C. EES Efficiencies SOFC η inver t
- Page 262 and 263:
C. EES ∆ p;GGHE X 1;c = −1 [kPa
- Page 264 and 265:
C. EES ˙Q loss;Bur n = 0 [kW ] ˙Q
- Page 266 and 267:
C. EES SOFC ∆ T ;SOFC ;av = 30 [C
- Page 268 and 269:
C. EES C.2 Results - Standard param
- Page 270 and 271:
C. EES 244 DES2 h;o = 42 DES2 i = 7
- Page 272 and 273:
C. EES SOFC ano;i = 5 SOFC ano;o =
- Page 274 and 275:
C. EES Point T i p i ṁ i qu i h i
- Page 276 and 277:
C. EES C.3 Results - Optimized para
- Page 278 and 279:
C. EES ∆ T ;min;W GHE X 3;w;i = 1
- Page 280 and 281:
C. EES ˙Q tr ans;W GHE X 3 = 2,752
- Page 282 and 283:
C. EES Point T i p i ṁ i qu i h i
- Page 284 and 285:
C. EES C.4 Results - Uncertainty pr
- Page 286 and 287:
C. EES ∆T ;min;W GHE X 3;w;i = 15
- Page 288 and 289:
C. EES ∆p;TOW ER1;air ;dr y = 0,1
- Page 290 and 291:
C. EES ∆p;GGHE X 1;c = −1 ±
- Page 292 and 293:
C. EES C.4.4 ∆p for absorption su
- Page 294 and 295:
C. EES C.4.5 ˙Qloss for absorption
- Page 297 and 298:
A P P E N D I X D OTHER D.1 Explana
- Page 299 and 300:
D.3. Water consumption Hence it is
- Page 301 and 302:
A P P E N D I X E OPTIMIZATION GRAP
- Page 303 and 304:
E.1. Simulations and Results E.1.2
- Page 305 and 306:
E.1. Simulations and Results Figure
- Page 307 and 308:
E.1. Simulations and Results Figure
- Page 309:
E.2. Cases E.2 Cases E.2.1 Extreme
- Page 312 and 313:
SEG Scandinavian Energy Group Aps.
- Page 314 and 315:
SEG Scandinavian Energy Group Aps.
- Page 316 and 317:
SEG Scandinavian Energy Group Aps.
- Page 318 and 319:
SEG Scandinavian Energy Group Aps.
- Page 320 and 321:
8 SPG 1 10 1-α GGHEX1 9 α 7 GGHEX
- Page 322:
1 8 GGHEX1 CH4, in Air, in 21 2 11