- Page 1 and 2:
draft Red Herring Prospectus Dated
- Page 3 and 4:
DEFINITIONS AND ABBREVIATIONS Term
- Page 5 and 6:
EPS Earnings per Share Equity Share
- Page 7 and 8:
Limited, K Raheja IT Park (Hyderaba
- Page 9 and 10:
SCRR Securities Contracts (Regulati
- Page 11 and 12:
SECTION I: RISK FACTORS CERTAIN CON
- Page 13 and 14:
RISK FACTORS Any investment in Equi
- Page 15 and 16:
we may require. Should we not execu
- Page 17 and 18:
unable to state with certainty abou
- Page 19 and 20:
in management, reduction in Promote
- Page 21 and 22:
We face competition for customers f
- Page 23 and 24:
27. Some of our Subsidiaries / Prom
- Page 25 and 26:
same in future. Currently none of t
- Page 27 and 28:
13. After this issue, the price of
- Page 29 and 30:
are mere irritants, others signific
- Page 31 and 32:
Our Success Factors We believe the
- Page 33 and 34:
Corporate Information Shopper’s S
- Page 35 and 36:
(Rupees in Millions except per shar
- Page 37 and 38:
GENERAL INFORMATION Shopper’s Sto
- Page 39 and 40:
2. ON THE BASIS OF SUCH EXAMINATION
- Page 41 and 42:
Filing A copy of the Red Herring Pr
- Page 43 and 44:
Co-Book Running Manager IL&FS INVES
- Page 45 and 46:
9 Running the Book, Deciding pricin
- Page 47 and 48:
Bankers to the Company UTI Bank Lim
- Page 49 and 50:
Enam Securities Pvt Limited 84B, Kh
- Page 51 and 52:
(a) At an Extra Ordinary General Me
- Page 53 and 54:
11. Our Promoters, Promoters Group,
- Page 55 and 56:
Top ten shareholders two years prio
- Page 57 and 58:
Particulars ESOP - I (01-02) At fac
- Page 59 and 60:
OBJECTS OF THE ISSUE The Objects of
- Page 61 and 62:
As at the date of this draft Red He
- Page 63 and 64:
All India - Distribution of househo
- Page 65 and 66:
Exposure to international trends
- Page 67 and 68:
The Indian apparel market The brand
- Page 69 and 70:
Growth in Organised Retail Share of
- Page 71 and 72:
Global Retail Business …changing
- Page 73 and 74:
The Indian Mall Scene in 2005 30 25
- Page 75 and 76:
Modern Retailing Formats Format Def
- Page 77 and 78:
Shopper’s Stop business has grown
- Page 79 and 80:
Experienced professional management
- Page 81 and 82:
4. Introducing new brands and devel
- Page 83 and 84:
DISTRIBUTION & LOGISTICS Our operat
- Page 85 and 86:
Gurgaon Mumbai (6) Jaipur Bangalore
- Page 87 and 88:
Visual Merchandising We use our Vis
- Page 89 and 90:
Our arrangements with our vendors W
- Page 91 and 92:
4. Reduce operational risks by perm
- Page 93 and 94:
Human Resources RAMCO HRMS 2001 Our
- Page 95 and 96:
Communication to Employees We also
- Page 97 and 98:
Milestones of Our Business Year Eve
- Page 99 and 100:
24, November, 2003 March 31, 2004 J
- Page 101 and 102:
Carlton Trading Private Limited K.
- Page 103 and 104:
Mr. Basavanhalli S Nagesh CCA, Mana
- Page 105 and 106:
D/o Mr. Veeragnanta Venkata Ramana
- Page 107 and 108:
The provisions of the Listing Agree
- Page 109 and 110:
Change in Board of Directors in the
- Page 111 and 112:
Changes in our Key Managerial Perso
- Page 113 and 114:
Mr. Ravi C. Raheja, 33, B.Com and M
- Page 115 and 116:
CASA MARIA PROPERTIES PRIVATE LIMIT
- Page 117 and 118:
Cape Trading Pvt. Ltd. 17.49 Anbee
- Page 119 and 120:
Raghukool Estate Development Pvt. L
- Page 121 and 122:
Financial Performance The financial
- Page 123 and 124:
Shareholding Pattern The shareholdi
- Page 125 and 126:
channels of business either directl
- Page 127 and 128: Shareholding Pattern As on July 31,
- Page 129 and 130: BEACH HAVEN PROPERTIES PRIVATE LIMI
- Page 131 and 132: Shareholding Pattern: The sharehold
- Page 133 and 134: K. RAHEJA SERVICES PRIVATE LIMITED.
- Page 135 and 136: This company is a part of the K. Ra
- Page 137 and 138: apartment structures or residential
- Page 139 and 140: Financial Performance The financial
- Page 141 and 142: Shareholding Pattern: The sharehold
- Page 143 and 144: Financial Performance The financial
- Page 145 and 146: However, since these entities were
- Page 147 and 148: Casa Maria Properties Pvt. Ltd. 4.5
- Page 149 and 150: K. RAHEJA DEVELOPMENT & CONSTRUCTIO
- Page 151 and 152: Names of Shareholder Percentage Sha
- Page 153 and 154: Mumbai Undivided Properties and Ent
- Page 155 and 156: Matsyagandha Investments & Finance
- Page 157 and 158: Shareholding Pattern: The sharehold
- Page 159 and 160: NANDJYOT PROPERTIES & HOTELS PVT. L
- Page 161 and 162: Shri C.L. Raheja HUF 4.19 Shri C.L.
- Page 163 and 164: Sheilla Mittal 6 Badal Mittal (HUF)
- Page 165 and 166: Nitin D.Advani 15 Gavotte Traders P
- Page 167 and 168: RELATED PARTY TRANSACTION Related p
- Page 169 and 170: SECTION IV: FINANCIAL INFORMATION M
- Page 171 and 172: Customer Entry Period ending March
- Page 173 and 174: Vendor Arrangements As a retailer,
- Page 175 and 176: We also receive sponsorship income,
- Page 177: Administration expenses include exp
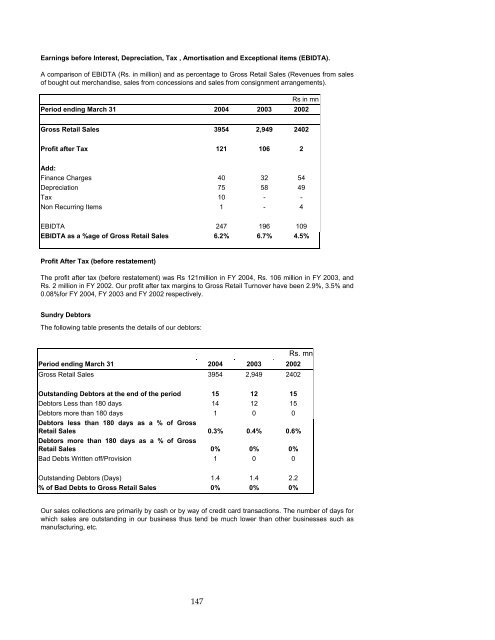
- Page 181 and 182: Earnings before Interest, Depreciat
- Page 183 and 184: Earnings before Interest Depreciati
- Page 185 and 186: Our capital expenditure plan as per
- Page 187 and 188: 7. Seasonality of business Our busi
- Page 189 and 190: Company Year ended Audited by SSL 3
- Page 191 and 192: A . B SHOPPERS' STOP LIMITED ANNEXU
- Page 193 and 194: Net Profit/(Loss) after Tax as per
- Page 195 and 196: an item from the concession store.
- Page 197 and 198: NOTES TO THE SUMMARY STATEMENTS (Ru
- Page 199 and 200: 9. On 31 March 2004 the Company eff
- Page 201 and 202: 170 31st March, 2001 Purchase of Me
- Page 203 and 204: INCOME SALES : UPASNA TRADING LIMIT
- Page 205 and 206: Liability for leave encashment, a d
- Page 207 and 208: 176 Depreciation (%) Asset Previous
- Page 209 and 210: INCOME SALES : Of Products Traded i
- Page 211 and 212: effective ownership control is reta
- Page 213 and 214: 6. The Company acquired its present
- Page 215 and 216: INCOME SALES : Service Charges Othe
- Page 217 and 218: SHOPPERS' STOP. COM (INDIA) LIMITED
- Page 219 and 220: SHOPPERS’ STOP. COM INDIA LIMITED
- Page 221 and 222: SHOPPERS' STOP LIMITED ANNEXURE V A
- Page 223 and 224: SHOPPERS' STOP LIMITED ANNEXURE VII
- Page 225 and 226: SHOPPERS' STOP LIMITED ANNEXURE - I
- Page 227 and 228: Investment in Upasna Trading Pvt. L
- Page 229 and 230:
7. Under section 54ED of the Income
- Page 231 and 232:
SHOPPERS' STOP LIMITED ANNEXURE XII
- Page 233 and 234:
SHOPPERS' STOP LIMITED ANNEXURE XII
- Page 235 and 236:
4. The future minimum rental paymen
- Page 237 and 238:
Since trading of our Equity Shares
- Page 239 and 240:
Who can Apply ** Terms of Payment M
- Page 241 and 242:
Note: The BRLMs, Co-BRM ,Syndicate
- Page 243 and 244:
evision in the Price Band, the Issu
- Page 245 and 246:
Investor Category such as Individua
- Page 247 and 248:
Advertisement regarding Issue Price
- Page 249 and 250:
3. Only Employees on the rolls of t
- Page 251 and 252:
(vii) On or after the Designated Da
- Page 253 and 254:
) an agreement dated ---------- wit
- Page 255 and 256:
Interest on Refund of excess Bid Am
- Page 257 and 258:
occupy a prime location in the mall
- Page 259 and 260:
SECTION VI: LEGAL AND REGULATORY IN
- Page 261 and 262:
OUTSTANDING LITIGATIONS Except as d
- Page 263 and 264:
M. Pending Litigations of companies
- Page 265 and 266:
E) Litigation pending -Customs and
- Page 267 and 268:
Rahej a (Resp- 4) 236 Group in thes
- Page 269 and 270:
sources'. The company filed an appe
- Page 271 and 272:
ASSESSMENT YEAR -1997-98 K. Raheja
- Page 273 and 274:
ASSESSMENT YEAR -1999-00 K. Raheja
- Page 275 and 276:
espect of the adjacent plot No 96.
- Page 277 and 278:
Suit No. 542 of 2000 Court of Civil
- Page 279 and 280:
The Resort ,a division of K. Raheja
- Page 281 and 282:
1993. Aggrieved by the order of the
- Page 283 and 284:
D) Litigation Pending - Sales Tax /
- Page 285 and 286:
High Court of Mumbai HC-WP(PIL)NO 9
- Page 287 and 288:
Small Causes Court, Bandra Rent Arr
- Page 289 and 290:
into arrangement and settlement at
- Page 291 and 292:
Undivided Entities or the Residual
- Page 293 and 294:
Small Cause Court, Bandra Rent Arre
- Page 295 and 296:
L) Arrears on cumulative preference
- Page 297 and 298:
The order of Commissioner of Income
- Page 299 and 300:
Writ Petition No. 39258 & 59/1999 M
- Page 301 and 302:
City Civil Court, Bangalore MA 170
- Page 303 and 304:
S.M. Ramachandra, S.M. Krishnappa s
- Page 305 and 306:
Case No. DUS/45-A/DVL/827/98-99 Sub
- Page 307 and 308:
Case No. DUS/45-A/DVL/2/94-95 Sub-R
- Page 309 and 310:
Case No. 45-A/DVL/SM/71/94-95 Sub-R
- Page 311 and 312:
Case No. 45-A/DVL/SM/81/94-95 Sub-R
- Page 313 and 314:
Case No. 45-A/DVL/63/96-97 (PO) Sub
- Page 315 and 316:
Case No. 45-A/DVL/7/98-99 (PO) Sub-
- Page 317 and 318:
Case No. 45-A/DVL/52/96-97(PO) Sub-
- Page 319 and 320:
Case No. 45-A/DVL/66/96-97(PO) Sub-
- Page 321 and 322:
Writ Petition No.3480/2001 Raj Trus
- Page 323 and 324:
H) Litigation Pending - Labour, Emp
- Page 325 and 326:
Complaint. No.875/2002 City Civil C
- Page 327 and 328:
eminder letters dated 2 nd November
- Page 329 and 330:
D) Litigation pending - Sales Tax /
- Page 331 and 332:
Metropolitan Magistrate,Mumbai CC N
- Page 333 and 334:
G) Economic / criminal / civil offe
- Page 335 and 336:
Assessment Year 2000-01(local) K.R
- Page 337 and 338:
M) Pending Litigations of companies
- Page 339 and 340:
Brief details of the above material
- Page 341 and 342:
( i) Maharashtra-Mumbai - Andheri -
- Page 343 and 344:
4. Rajasthan - Jaipur 1420 / 05116
- Page 345 and 346:
OUR SUBSIDIARIES We have not receiv
- Page 347 and 348:
case a Bid is rejected in part, the
- Page 349 and 350:
Method of Proportionate Basis of Al
- Page 351 and 352:
Purchase/ of Property NEW STORES Sr
- Page 353 and 354:
Remuneration of Managing Director M
- Page 355 and 356:
FORFEITURE OF SHARES 41. If a Membe
- Page 357 and 358:
shall be conclusive evidence of the
- Page 359 and 360:
63. If the Person aforesaid shall e
- Page 361 and 362:
Notice of Proposed Transfer 70. Bef
- Page 363 and 364:
(l) Any one of two or more joint ho
- Page 365 and 366:
90. The chairman, if any, of the Bo
- Page 367 and 368:
106. The instrument appointing a pr
- Page 369 and 370:
the validity of the said representa
- Page 371 and 372:
166. Any General Meeting may, subje
- Page 373 and 374:
MATERIAL CONTRACTS AND DOCUMENTS FO
- Page 375:
DECLARATION All the relevant provis