- Page 7 and 8:
Highlights of the Pakistan Economic
- Page 10 and 11:
Highlights of the Pakistan Economic
- Page 14 and 15:
Highlights of the Pakistan Economic
- Page 16 and 17:
Highlights of the Pakistan Economic
- Page 18 and 19:
Highlights of the Pakistan Economic
- Page 20 and 21:
Highlights of the Pakistan Economic
- Page 22 and 23:
Pakistan Economic Survey 2011-12Ass
- Page 24 and 25:
Pakistan Economic Survey 2011-12gen
- Page 26 and 27:
Pakistan Economic Survey 2011-12fir
- Page 28 and 29:
Pakistan Economic Survey 2011-12ene
- Page 30 and 31:
Pakistan Economic Survey 2011-12sup
- Page 32 and 33:
Pakistan Economic Survey 2011-12Add
- Page 34 and 35:
SOCIAL INDICATORS2001-02 2002-03 20
- Page 36 and 37:
SOCIAL INDICATORS2000-01 2001-02 20
- Page 38 and 39:
SOCIAL INDICATORS2001-02 2002-03 20
- Page 40 and 41:
Pakistan Economic Survey 2011-12Tab
- Page 42 and 43:
Special SectionPakistan: Flood Impa
- Page 44 and 45:
Pakistan: Flood Impact AssessmentHe
- Page 46 and 47:
Pakistan: Flood Impact AssessmentTa
- Page 48 and 49:
district roads (including farm-to-m
- Page 50 and 51:
Pakistan: Flood Impact AssessmentAf
- Page 52 and 53:
System. The main canals are the Pat
- Page 54 and 55:
Chapter 2AgricultureThe agriculture
- Page 56 and 57:
Agricultureagriculture. Livestock c
- Page 58 and 59:
AgricultureTable 2.6: Area, Product
- Page 60 and 61:
Agricultureb) Minor Cropsi) Oilseed
- Page 62 and 63:
During July-March, 2011-12 about 36
- Page 64 and 65:
It is expected about Rs. 30.00 bill
- Page 66 and 67:
AgricultureBox-1Credit Disbursement
- Page 68 and 69:
AgricultureTable:2.20 Estimated Liv
- Page 70 and 71:
AgriculturePoultry Development poli
- Page 72 and 73:
AgricultureIn this connection, two
- Page 74 and 75:
Pakistan Economic Survey 2011-12Tab
- Page 76 and 77:
Pakistan Economic Survey 2011-12in
- Page 78 and 79:
Pakistan Economic Survey 2011-122ca
- Page 80 and 81:
Pakistan Economic Survey 2011-12aga
- Page 82 and 83:
Pakistan Economic Survey 2011-12in
- Page 84 and 85:
Pakistan Economic Survey 2011-12GDP
- Page 86 and 87:
Pakistan Economic Survey 2011-12eff
- Page 88 and 89:
Pakistan Economic Survey 2011-12env
- Page 90 and 91:
Chapter 3Manufacturing and Mining3.
- Page 92 and 93:
Manufacturing and MiningManufacturi
- Page 94 and 95:
Manufacturing and MiningBox-2LSM Da
- Page 96 and 97:
(i) Cotton Spinning SectorThe spinn
- Page 98 and 99:
Manufacturing and Miningyear. Howev
- Page 100 and 101:
Manufacturing and MiningEast. Expor
- Page 102 and 103: Manufacturing and Miningsubstitute
- Page 104 and 105: Pakistan Economic Survey 2011-12Box
- Page 106 and 107: Pakistan Economic Survey 2011-122te
- Page 108 and 109: Pakistan Economic Survey 2011-12Tab
- Page 110 and 111: Pakistan Economic Survey 2011-12•
- Page 112 and 113: Pakistan Economic Survey 2011-12Tab
- Page 114 and 115: Pakistan Economic Survey 2011-12Tab
- Page 116 and 117: Pakistan Economic Survey 2011-12The
- Page 118 and 119: Pakistan Economic Survey 2011-12une
- Page 120 and 121: Pakistan Economic Survey 2011-122-
- Page 122 and 123: Pakistan Economic Survey 2011-12Mar
- Page 124 and 125: Pakistan Economic Survey 2011-12pro
- Page 126 and 127: Pakistan Economic Survey 2011-122Pe
- Page 128 and 129: Pakistan Economic Survey 2011-12sta
- Page 130 and 131: Pakistan Economic Survey 2011-12mic
- Page 132 and 133: Pakistan Economic Survey 2011-12ope
- Page 134 and 135: Pakistan Economic Survey 2011-12cap
- Page 136 and 137: Pakistan Economic Survey 2011-12Tab
- Page 138 and 139: Pakistan Economic Survey 2011-12The
- Page 140 and 141: Pakistan Economic Survey 2011-12pro
- Page 142 and 143: Pakistan Economic Survey 2011-12han
- Page 144 and 145: Pakistan Economic Survey 2011-12oos
- Page 146 and 147: Pakistan Economic Survey 2011-12Tab
- Page 148 and 149: Pakistan Economic Survey 2011-12Tab
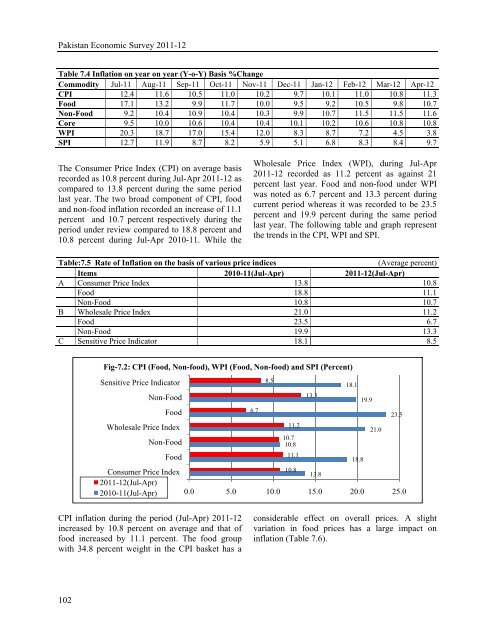
- Page 150 and 151: Chapter 7InflationThe global econom
- Page 154 and 155: Table:7.6 Rate of Inflation on the
- Page 156 and 157: InflationPercent1918171615141312111
- Page 158 and 159: InflationTable:7.11 Essential items
- Page 160 and 161: InflationRegional PricesPrices of e
- Page 162 and 163: Chapter 8Trade and PaymentsThe unfa
- Page 164 and 165: Trade and Paymentsthe services acco
- Page 166 and 167: This was mainly due to current acco
- Page 168 and 169: Trade and PaymentsTable 8.3: Struct
- Page 170 and 171: Trade and Paymentsconcentration is
- Page 172 and 173: Table 8.6: Structure of ImportsPart
- Page 174 and 175: Trade and PaymentsAmendments in Exp
- Page 176 and 177: Pakistan Economic Survey 2011-129.2
- Page 178 and 179: Pakistan Economic Survey 2011-12Tab
- Page 180 and 181: Pakistan Economic Survey 2011-129.3
- Page 182 and 183: Pakistan Economic Survey 2011-122to
- Page 184 and 185: Pakistan Economic Survey 2011-122Ta
- Page 186 and 187: Pakistan Economic Survey 2011-12cap
- Page 188 and 189: Pakistan Economic Survey 2011-12Lit
- Page 190 and 191: Pakistan Economic Survey 2011-12in
- Page 192 and 193: Pakistan Economic Survey 2011-12lea
- Page 194 and 195: Pakistan Economic Survey 2011-12Hig
- Page 196 and 197: Pakistan Economic Survey 2011-12int
- Page 198 and 199: Pakistan Economic Survey 2011-12of
- Page 200 and 201: Chapter 11Health and NutritionAcces
- Page 202 and 203:
Health and NutritionHealth Expendit
- Page 204 and 205:
achieved in the case of BHUs and 95
- Page 206 and 207:
Health and Nutritionglobal initiati
- Page 208 and 209:
Health and Nutritiontook necessary
- Page 210 and 211:
Chapter 12Population Labour Force a
- Page 212 and 213:
Age Composition of PopulationThe ag
- Page 214 and 215:
Population, Labour Force and Employ
- Page 216 and 217:
Population, Labour Force and Employ
- Page 218 and 219:
Population, Labour Force and Employ
- Page 220 and 221:
Population, Labour Force and Employ
- Page 222 and 223:
Table-12.16: Unemployed - Pakistan
- Page 224 and 225:
Population, Labour Force and Employ
- Page 226 and 227:
Pakistan Economic Survey 2011-12Tab
- Page 228 and 229:
Pakistan Economic Survey 2011-12Cha
- Page 230 and 231:
Pakistan Economic Survey 2011-1213.
- Page 232 and 233:
Pakistan Economic Survey 2011-12213
- Page 234 and 235:
Pakistan Economic Survey 2011-1222,
- Page 236 and 237:
Pakistan Economic Survey 2011-12ban
- Page 238 and 239:
Pakistan Economic Survey 2011-1213.
- Page 240 and 241:
Chapter 14EnergyEnergy is considere
- Page 242 and 243:
EnergyStock Issue• Recovery of re
- Page 244 and 245:
Energy14.1 Energy ConsumptionPakist
- Page 246 and 247:
Energyto 21.4 percent last year. Th
- Page 248 and 249:
Energy14.2-d CoalPakistan has huge
- Page 250 and 251:
tariff increases of 6%, 12% and 6%
- Page 252 and 253:
Energy14.3-b Petroleum ProductsPetr
- Page 254 and 255:
Energybecome a popular domestic fue
- Page 256 and 257:
EnergyAlso Laraib Energy Limited (
- Page 258 and 259:
EnergyTable 14.14: Oil and Gas Disc
- Page 260 and 261:
Energy14.5 Performance of Power Sec
- Page 262 and 263:
Energytrend of hydro-thermal energy
- Page 264 and 265:
Energy14.5-c Private Power and Infr
- Page 266 and 267:
Energy Proposal for undertaking a f
- Page 268 and 269:
Chapter 15Social Safety NetsBackgro
- Page 270 and 271:
Social Safety NetsBox-1Poverty Alle
- Page 272 and 273:
Social Safety NetsTable 15.4: Perce
- Page 274 and 275:
Social Safety Netsenterprise develo
- Page 276 and 277:
Social Safety Netsdignity of househ
- Page 278 and 279:
period of last year. Furthermore, i
- Page 280 and 281:
Social Safety Netsand ensure growth
- Page 282 and 283:
Pakistan Economic Survey 2011-12ind
- Page 284 and 285:
Pakistan Economic Survey 2011-12To
- Page 286 and 287:
Pakistan Economic Survey 2011-12Mot
- Page 288 and 289:
Pakistan Economic Survey 2011-12TSS
- Page 290 and 291:
Pakistan Economic Survey 2011-12RED
- Page 292:
Pakistan Economic Survey 2011-12The


