- Page 2:
Multi-Carrier andSpread SpectrumSys
- Page 6 and 7:
This edition first published 2008©
- Page 11 and 12:
Contentsix4.3.2 One-Dimensional Cha
- Page 13:
ForewordThis book discusses multi-c
- Page 17 and 18:
Preface (First Edition)Nowadays, mu
- Page 19:
AcknowledgementsThe authors would l
- Page 22 and 23:
2 Introductionambitious technologic
- Page 24 and 25:
4 IntroductionTables 1 and 2 summar
- Page 26 and 27:
6 IntroductionPower densityTimeFreq
- Page 28 and 29:
8 Introductiona high immunity again
- Page 30 and 31:
10 Introductionprocessing gain P G
- Page 32 and 33:
12 Introductionand interactive mult
- Page 34 and 35:
14 Introduction[43] Saltzberg, B. R
- Page 36 and 37:
16 FundamentalsBSTSFigure 1-1Time-v
- Page 38 and 39:
18 Fundamentalswhere p =|a p | 2 (1
- Page 40 and 41:
20 Fundamentalssuch that the effect
- Page 42 and 43:
22 FundamentalsTable 1-2 Delay powe
- Page 44 and 45:
24 Fundamentals(i) Fixed Positioned
- Page 46 and 47:
26 Fundamentalson sub-channel n of
- Page 48 and 49:
28 Fundamentals10 010 −1OFDM (OFD
- Page 50 and 51:
30 Fundamentalsin order to achieve
- Page 52 and 53:
32 FundamentalsThe discrete length
- Page 54 and 55:
34 FundamentalsThe following matrix
- Page 56 and 57:
36 FundamentalsTable 1-11Wireless l
- Page 58 and 59:
38 FundamentalsFrequency hopping (F
- Page 60 and 61:
40 FundamentalsFinally, a threshold
- Page 62 and 63:
42 Fundamentals1.3.3 Applications o
- Page 64 and 65:
44 FundamentalsTable 1-12Radio link
- Page 66 and 67:
46 FundamentalsOrthogonalV-SF codeF
- Page 68 and 69:
{{48 Fundamentalsdata symbolsspread
- Page 70 and 71:
50 FundamentalsCellular Mobile Radi
- Page 72 and 73:
52 Fundamentals[27] Haindl B., “M
- Page 75 and 76:
2MC-CDMA and MC-DS-CDMAIn this chap
- Page 77 and 78:
MC-CDMA 57whered = (d (0) ,d (1) ,.
- Page 79 and 80:
MC-CDMA 59i.e. the spreading is per
- Page 81 and 82:
MC-CDMA 61Table 2-1 PAPR bounds of
- Page 83 and 84:
MC-CDMA 632.1.4.4 Rotated Constella
- Page 85 and 86:
MC-CDMA 65After inverse OFDM the re
- Page 87 and 88:
MC-CDMA 67and requires only informa
- Page 89 and 90:
MC-CDMA 69hard interference evaluat
- Page 91 and 92:
MC-CDMA 71Thedataofthedesireduserk
- Page 93 and 94:
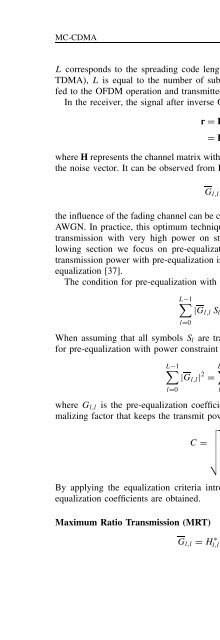
MC-CDMA 73L corresponds to the spre
- Page 95 and 96:
MC-CDMA 752.1.7 Combined Equalizati
- Page 97 and 98:
MC-CDMA 77broadcasting, WLAN, and W
- Page 99 and 100:
MC-CDMA 792.1.8.1 Log-Likelihood Ra
- Page 101 and 102:
MC-CDMA 81For coded MC-CDMA systems
- Page 103 and 104:
MC-CDMA 83where Q different user gr
- Page 105 and 106:
MC-CDMA 85Table 2-2MC-CDMA system p
- Page 107 and 108:
MC-CDMA 87first iteration. The opti
- Page 109 and 110:
MC-CDMA 8910 010 −110 −2BER10
- Page 111 and 112:
MC-CDMA 9110 010 −1BER10 −210
- Page 113 and 114:
MC-CDMA 9310 010 −110 −2BER10
- Page 115 and 116:
MC-DS-CDMA 95c (k) (t)f 00d (k)S/P+
- Page 117 and 118:
MC-DS-CDMA 97The user-specific dela
- Page 119 and 120:
MC-DS-CDMA 9910 010 −1BER10 −21
- Page 121 and 122:
References 101[7] Brüninghaus K. a
- Page 123:
References 103[49] Steiner B., “U
- Page 126 and 127:
106 Hybrid Multiple Access SchemesI
- Page 128 and 129:
108 Hybrid Multiple Access Schemesw
- Page 130 and 131:
110 Hybrid Multiple Access Schemest
- Page 132 and 133:
112 Hybrid Multiple Access SchemesO
- Page 134 and 135: 114 Hybrid Multiple Access SchemesT
- Page 136 and 137: 116 Hybrid Multiple Access SchemesA
- Page 138 and 139: 118 Hybrid Multiple Access SchemesT
- Page 140 and 141: 120 Hybrid Multiple Access Schemest
- Page 142 and 143: 122 Hybrid Multiple Access SchemesA
- Page 144 and 145: 124 Hybrid Multiple Access SchemesT
- Page 146 and 147: 126 Hybrid Multiple Access Schemes[
- Page 149 and 150: 4Implementation IssuesA general PHY
- Page 151 and 152: Multi-Carrier Modulation and Demodu
- Page 153 and 154: Multi-Carrier Modulation and Demodu
- Page 155 and 156: Multi-Carrier Modulation and Demodu
- Page 157 and 158: Multi-Carrier Modulation and Demodu
- Page 159 and 160: Synchronization 139The performance
- Page 161 and 162: Synchronization 141null symbol as a
- Page 163 and 164: Synchronization 143resulting SNR ca
- Page 165 and 166: Synchronization 145SNR Degradation
- Page 167 and 168: Synchronization 147FFTr(k)estimated
- Page 169 and 170: Synchronization 149the timing error
- Page 171 and 172: Synchronization 151A first simple s
- Page 173 and 174: Synchronization 153Transmitted 2 re
- Page 175 and 176: Channel Estimation 155Special cases
- Page 177 and 178: Channel Estimation 157The mean squa
- Page 179 and 180: Channel Estimation 159by the second
- Page 181 and 182: Channel Estimation 161Given the nor
- Page 183: Channel Estimation 163and f D, filt
- Page 187 and 188: Channel Estimation 16710 010 −13
- Page 189 and 190: Channel Estimation 169in order to r
- Page 191 and 192: Channel Estimation 17110 010 −1BU
- Page 193 and 194: Channel Estimation 173timefreq. 00
- Page 195 and 196: Channel Coding and Decoding 1754.4.
- Page 197 and 198: Channel Coding and Decoding 177Tabl
- Page 199 and 200: Channel Coding and Decoding 179a (k
- Page 201 and 202: Channel Coding and Decoding 181n rk
- Page 203 and 204: Channel Coding and Decoding 183Bit
- Page 205 and 206: Channel Coding and Decoding 185Bit
- Page 207 and 208: Signal Constellation, Mapping, De-M
- Page 209 and 210: Signal Constellation, Mapping, De-M
- Page 211 and 212: Adaptive Techniques in Multi-Carrie
- Page 213 and 214: RF Issues 193hence reduce, for inst
- Page 215 and 216: RF Issues 195s(t)r(t)e jf(t)White n
- Page 217 and 218: RF Issues 197receivedsignalto detec
- Page 219 and 220: RF Issues 1994.7.2.1 Effects of Non
- Page 221 and 222: RF Issues 2011e−011e−02UplinkDo
- Page 223 and 224: RF Issues 203of data pre-distortion
- Page 225 and 226: RF Issues 205Table 4-8Minimum total
- Page 227 and 228: RF Issues 207Detection strategyIn t
- Page 229 and 230: RF Issues 209above formula becomes(
- Page 231 and 232: References 211[21] Fazel K., “Nar
- Page 233 and 234: References 213[66] Nobilet S., Hela
- Page 235 and 236:
5Applications5.1 IntroductionThe de
- Page 237 and 238:
Introduction 217high speed as well
- Page 239 and 240:
3GPP Long Term Evolution (LTE) 219H
- Page 241 and 242:
3GPP Long Term Evolution (LTE) 221U
- Page 243 and 244:
3GPP Long Term Evolution (LTE) 2231
- Page 245 and 246:
3GPP Long Term Evolution (LTE) 2251
- Page 247 and 248:
3GPP Long Term Evolution (LTE) 227T
- Page 249 and 250:
3GPP Long Term Evolution (LTE) 229C
- Page 251 and 252:
3GPP Long Term Evolution (LTE) 2311
- Page 253 and 254:
3GPP Long Term Evolution (LTE) 233T
- Page 255 and 256:
3GPP Long Term Evolution (LTE) 235T
- Page 257 and 258:
WiMAX 237Table 5-12 Downlink LTE sp
- Page 259 and 260:
WiMAX 239Wi-FiBusinessTSWiMAX BSTSM
- Page 261 and 262:
WiMAX 241Table 5-16Summary of the I
- Page 263 and 264:
WiMAX 243WiMAXInteroperabilityInter
- Page 265 and 266:
WiMAX 245UNIAirinterfaceSNITerminal
- Page 267 and 268:
WiMAX 247Radio ResourceControlIniti
- Page 269 and 270:
WiMAX 249Frame n−1 Frame n Frame
- Page 271 and 272:
WiMAX 251Read RF-Channel ListScan F
- Page 273 and 274:
WiMAX 253NormaloperationTS measures
- Page 275 and 276:
WiMAX 255Table 5-18Example of some
- Page 277 and 278:
WiMAX 257Total bandwidth (between 1
- Page 279 and 280:
WiMAX 259Sub-carriers (frequency)n0
- Page 281 and 282:
ApplicationsWiMAX 261Table 5-23 Gen
- Page 283 and 284:
WiMAX 263Table 5-27(OFDMA)FEC codin
- Page 285 and 286:
WiMAX 265M-QAMMappingSTC withSpatia
- Page 287 and 288:
WiMAX 267Frame n−1 Frame n Frame
- Page 289 and 290:
WiMAX 269Table 5-29WirelessMAN-OFDM
- Page 291 and 292:
WiMAX 2710Power density in dB−25
- Page 293 and 294:
WiMAX 273Table 5-37diversityPeak da
- Page 295 and 296:
WiMAX 275Table 5-41DL link budget e
- Page 297 and 298:
Future Mobile Communications Concep
- Page 299 and 300:
Future Mobile Communications Concep
- Page 301 and 302:
Future Mobile Communications Concep
- Page 303 and 304:
Wireless Local Area Networks 283MTB
- Page 305 and 306:
Wireless Local Area Networks 285fre
- Page 307 and 308:
Interaction Channel for DVB-T: DVB-
- Page 309 and 310:
Interaction Channel for DVB-T: DVB-
- Page 311 and 312:
Interaction Channel for DVB-T: DVB-
- Page 313 and 314:
Interaction Channel for DVB-T: DVB-
- Page 315 and 316:
Interaction Channel for DVB-T: DVB-
- Page 317 and 318:
References 297Table 5-58Parameters
- Page 319:
References 299[32] Taoka H., Higuch
- Page 322 and 323:
302 Additional Techniques for Capac
- Page 324 and 325:
304 Additional Techniques for Capac
- Page 326 and 327:
306 Additional Techniques for Capac
- Page 328 and 329:
308 Additional Techniques for Capac
- Page 330 and 331:
310 Additional Techniques for Capac
- Page 332 and 333:
312 Additional Techniques for Capac
- Page 334 and 335:
314 Additional Techniques for Capac
- Page 336 and 337:
316 Additional Techniques for Capac
- Page 338 and 339:
318 Additional Techniques for Capac
- Page 340 and 341:
320 Additional Techniques for Capac
- Page 342 and 343:
322 Additional Techniques for Capac
- Page 344 and 345:
324 Additional Techniques for Capac
- Page 346 and 347:
326 Additional Techniques for Capac
- Page 348 and 349:
328 Additional Techniques for Capac
- Page 350 and 351:
330 Additional Techniques for Capac
- Page 352 and 353:
332 Additional Techniques for Capac
- Page 354 and 355:
334 Additional Techniques for Capac
- Page 356 and 357:
336 Additional Techniques for Capac
- Page 358 and 359:
338 Additional Techniques for Capac
- Page 360 and 361:
340 Definitions, Abbreviations, and
- Page 362 and 363:
342 Definitions, Abbreviations, and
- Page 364 and 365:
344 Definitions, Abbreviations, and
- Page 366 and 367:
346 Definitions, Abbreviations, and
- Page 368 and 369:
348 Definitions, Abbreviations, and
- Page 370 and 371:
350 SymbolsG l,lGG [j]h(t)h(τ,t)H(
- Page 373 and 374:
Index3GPP 218Adaptive techniques 19
- Page 375 and 376:
Index 355Forward error correction (
- Page 377 and 378:
Index 357Multi-carrier modulation a
- Page 379 and 380:
Index 359Maximum likelihood paramet