Sustainability Planning and Monitoring
Sustainability Planning and Monitoring
Sustainability Planning and Monitoring
- No tags were found...

Create successful ePaper yourself
Turn your PDF publications into a flip-book with our unique Google optimized e-Paper software.
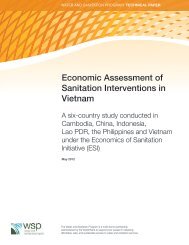
FROM THEORY TO PRACTICEFigure 17 Gender equity User in contributions cost-sharing to for constuction water servicesUser contributionto constructionUser contribution tooperation <strong>and</strong> maintenance1009080% of household contribution7060504030424265702058581035300Rich Poor Rich PoorMaleFemale●of the households being “wealthier” <strong>and</strong> 80-85 percent households being “poorer”. In thepoverty study carried out, the average of poorerhouseholds was slightly higher.It is interesting that in all projects the differencein access for the poor <strong>and</strong> rich was minimal,<strong>and</strong> that in each village generally there was away of dealing with the poorest householdsby letting them have water for free or for asmaller fee. With regard to contributions forconstruction, clearly everybody contributed, butoften each according to his or her means. Thisindicated that in Benin, villagers are well awarewhich families are poorest <strong>and</strong> reducing●contributions is an accepted compensatorycommunity practice for such families.In terms of contribution in cash for serviceestablishment, there was a certain measure ofequity, with women contributing marginally lessthan men <strong>and</strong> the poor contributing less thanthe wealthier households. Particularly, in themen’s group, poor men contributed on averagethree times less than men who were better off.However, continued payment after theestablishment of the service, in particular forthe payment of water, became a larger financialburden of women. This is illustrated in Figure17.108