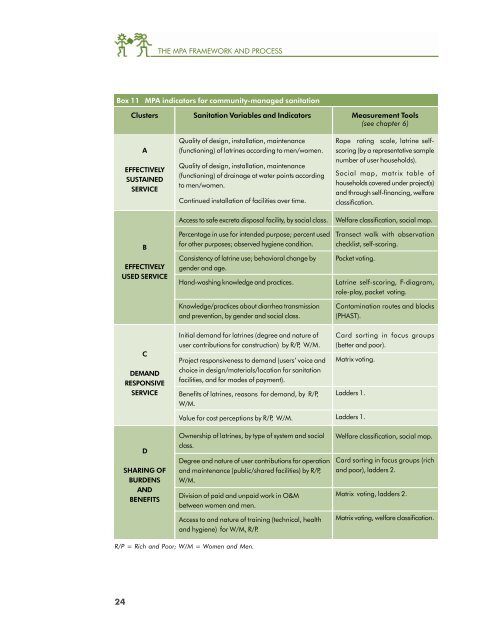
THE MPA FRAMEWORK AND PROCESSBox 11 MPA indicators for community-managed sanitationClusters Sanitation Variables <strong>and</strong> Indicators Measurement Tools(see chapter 6)AEFFECTIVELYSUSTAINEDSERVICEBEFFECTIVELYUSED SERVICEQuality of design, installation, maintenance(functioning) of latrines according to men/women.Quality of design, installation, maintenance(functioning) of drainage at water points accordingto men/women.Continued installation of facilities over time.Access to safe excreta disposal facility, by social class.Percentage in use for intended purpose; percent usedfor other purposes; observed hygiene condition.Consistency of latrine use; behavioral change bygender <strong>and</strong> age.H<strong>and</strong>-washing knowledge <strong>and</strong> practices.Knowledge/practices about diarrhea transmission<strong>and</strong> prevention, by gender <strong>and</strong> social class.Rope rating scale, latrine selfscoring(by a representative samplenumber of user households).Social map, matrix table ofhouseholds covered under project(s)<strong>and</strong> through self-financing, welfareclassification.Welfare classification, social map.Transect walk with observationchecklist, self-scoring.Pocket voting.Latrine self-scoring, F-diagram,role-play, pocket voting.Contamination routes <strong>and</strong> blocks(PHAST).CDEMANDRESPONSIVESERVICEDSHARING OFBURDENSANDBENEFITSInitial dem<strong>and</strong> for latrines (degree <strong>and</strong> nature ofuser contributions for construction) by R/P, W/M.Project responsiveness to dem<strong>and</strong> (users’ voice <strong>and</strong>choice in design/materials/location for sanitationfacilities, <strong>and</strong> for modes of payment).Benefits of latrines, reasons for dem<strong>and</strong>, by R/P,W/M.Value for cost perceptions by R/P, W/M.Ownership of latrines, by type of system <strong>and</strong> socialclass.Degree <strong>and</strong> nature of user contributions for operation<strong>and</strong> maintenance (public/shared facilities) by R/P,W/M.Division of paid <strong>and</strong> unpaid work in O&Mbetween women <strong>and</strong> men.Access to <strong>and</strong> nature of training (technical, health<strong>and</strong> hygiene) for W/M, R/P.Card sorting in focus groups(better <strong>and</strong> poor).Matrix voting.Ladders 1.Ladders 1.Welfare classification, social map.Card sorting in focus groups (rich<strong>and</strong> poor), ladders 2.Matrix voting, ladders 2.Matrix voting, welfare classification.R/P = Rich <strong>and</strong> Poor; W/M = Women <strong>and</strong> Men.24
THE MPA FRAMEWORK AND PROCESSThe MPA uses a basic definition of “dem<strong>and</strong>” asthe “willingness to pay, based on informedchoice.”Inherent in this definition are equity concernsrelated to the questions “whose dem<strong>and</strong>?” <strong>and</strong>“whose willingness to pay?” In the MPA, dem<strong>and</strong>is understood as the aggregate dem<strong>and</strong> of allsections of communities, i.e., both women <strong>and</strong>men, both the poor <strong>and</strong> the wealthier, bothminority <strong>and</strong> majority groups. “Payment” includesall forms in which the users may contribute, i.e.,in cash, in kind, <strong>and</strong> with time <strong>and</strong> energy forobtaining, operating, maintaining, <strong>and</strong> managingservices.Also inherent in this definition is the underst<strong>and</strong>ingthat “choice” means a lot more than technologyor cost options. The MPA uses the term to meanwho participates in which choices, i.e., whichgroups within the communities <strong>and</strong> householdsmake which of the several key decisions, such as:●●●●●initiation of the projects;the type of technologies <strong>and</strong> service levels;the location of the facilities;the local management, maintenance, <strong>and</strong>financing systems; <strong>and</strong>the c<strong>and</strong>idates for training.The “capacity to pay“ gets verified through theprocess of facilitating informed choice - anessential requirement of the dem<strong>and</strong>-responsiveapproach. It is not possible to assess “willingnessto pay” with any accuracy in the absence ofchoices <strong>and</strong> full information about choices beingoffered <strong>and</strong> discussed with potential consumers.Both willingness <strong>and</strong> capacity to pay can besurprisingly elastic, depending on what optionsare being offered, at what immediate <strong>and</strong> longertermcosts, <strong>and</strong> how clearly this information iscommunicated to <strong>and</strong> discussed with women <strong>and</strong>men from wealthier, intermediate, <strong>and</strong> poorgroups, who are all potential consumers ofservices. Gender-sensitive methods play animportant role in assessing the overall dem<strong>and</strong>for services (see example in Java case study,Section 2 of this report).While assessing dem<strong>and</strong>, it is also important toinvestigate <strong>and</strong> control for incentives in thepotential users’ environment which may distort theirwillingness or capacity to pay. For example, ifpeople believe that services might be provided freeof charge, they may have an incentive to say thatthey are too poor to pay. In such cases it may notbe possible to get an accurate assessment ofdem<strong>and</strong> until the initial stages of projectimplementation are under way. At this timepotential consumers can begin to see the real termsunder which the services are finally being provided.Dem<strong>and</strong>s <strong>and</strong> meeting dem<strong>and</strong>s are not staticissues. Continued maintenance <strong>and</strong> use ofservices <strong>and</strong> user payments depend on how wellthe improved facilities continue to match theexpectations <strong>and</strong> resources of the different groups.Users also continually compare how benefits relateto the costs of obtaining them.To underst<strong>and</strong> “dem<strong>and</strong>” in relation to sustainedservices, the MPA measures the satisfaction ofwomen <strong>and</strong> men (in wealthier <strong>and</strong> poorerhouseholds) with the improved facilities, theoperation <strong>and</strong> management of the facilities, <strong>and</strong>the effects of the same on their lives (extent ofdem<strong>and</strong> met). It relates these levels of satisfactionto what each group has contributed toconstruction <strong>and</strong> now contributes in the postconstructionphase, not only in cash but also intime, labor, <strong>and</strong> any other form (perceived valuefor cost). The analysis of these processes is doneacross time <strong>and</strong> at community as well as agencylevels. This reveals how processes at different levels<strong>and</strong> phases in the project cycle determine the finalresults of water supply <strong>and</strong> sanitation projects.25