
You also want an ePaper? Increase the reach of your titles
YUMPU automatically turns print PDFs into web optimized ePapers that Google loves.
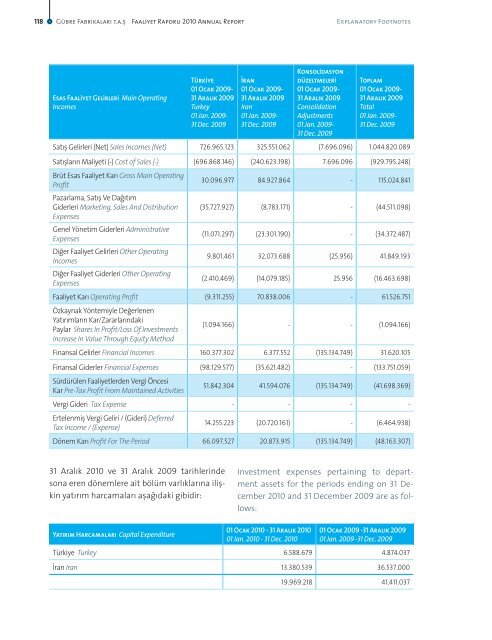
118<strong>Gübre</strong> <strong>Fabrikaları</strong> t.a.ş Faaliyet Raporu 2010 Annual ReportExplanatory FootnotesEsas Faaliyet Gelirleri Main OperatingIncomesTürkiye01 Ocak 2009-31 Aralık 2009Turkey01 Jan. 2009-31 Dec. 2009İran01 Ocak 2009-31 Aralık 2009Iran01 Jan. 2009-31 Dec. 2009Konsolidasyondüzeltmeleri01 Ocak 2009-31 Aralık 2009ConsolidationAdjustments01 Jan. 2009-31 Dec. 2009Toplam01 Ocak 2009-31 Aralık 2009Total01 Jan. 2009-31 Dec. 2009Satış Gelirleri (Net) Sales Incomes (Net) 726.965.123 325.551.062 (7.696.096) 1.044.820.089Satışların Maliyeti (-) Cost of Sales (-) (696.868.146) (240.623.198) 7.696.096 (929.795.248)Brüt Esas Faaliyet Karı Gross Main OperatingProfitPazarlama, Satış Ve DağıtımGiderleri Marketing, Sales And DistributionExpensesGenel Yönetim Giderleri AdministrativeExpensesDiğer Faaliyet Gelirleri Other OperatingIncomesDiğer Faaliyet Giderleri Other OperatingExpenses30.096.977 84.927.864 - 115.024.841(35.727.927) (8.783.171) - (44.511.098)(11.071.297) (23.301.190) - (34.372.487)9.801.461 32.073.688 (25.956) 41.849.193(2.410.469) (14.079.185) 25.956 (16.463.698)Faaliyet Karı Operating Profit (9.311.255) 70.838.006 - 61.526.751Özkaynak Yöntemiyle DeğerlenenYatırımların Kar/ZararlarındakiPaylar Shares In Profit/Loss Of InvestmentsIncrease In Value Through Equity Method(1.094.166) - - (1.094.166)Finansal Gelirler Financial Incomes 160.377.302 6.377.552 (135.134.749) 31.620.105Finansal Giderler Financial Expenses (98.129.577) (35.621.482) - (133.751.059)Sürdürülen Faaliyetlerden Vergi ÖncesiKar Pre-Tax Profit From Maintained Activities51.842.304 41.594.076 (135.134.749) (41.698.369)Vergi Gideri Tax Expense - - - -Ertelenmiş Vergi Geliri / (Gideri) DeferredTax Income / (Expense)14.255.223 (20.720.161) - (6.464.938)Dönem Karı Profit For The Period 66.097.527 20.873.915 (135.134.749) (48.163.307)31 Aralık 2010 ve 31 Aralık 2009 tarihlerindesona eren dönemlere ait bölüm varlıklarına ilişkinyatırım harcamaları aşağıdaki gibidir:Investment expenses pertaining to departmentassets for the periods ending on 31 December2010 and 31 December 2009 are as follows:Yatırım Harcamaları Capital Expenditure01 Ocak 2010 - 31 Aralık 201001 Jan. 2010 - 31 Dec. 201001 Ocak 2009 -31 Aralık 200901 Jan. 2009 -31 Dec. 2009Türkiye Turkey 6.588.679 4.874.037İran Iran 13.380.539 36.537.00019.969.218 41.411.037