
Create successful ePaper yourself
Turn your PDF publications into a flip-book with our unique Google optimized e-Paper software.
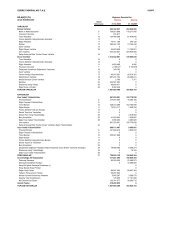
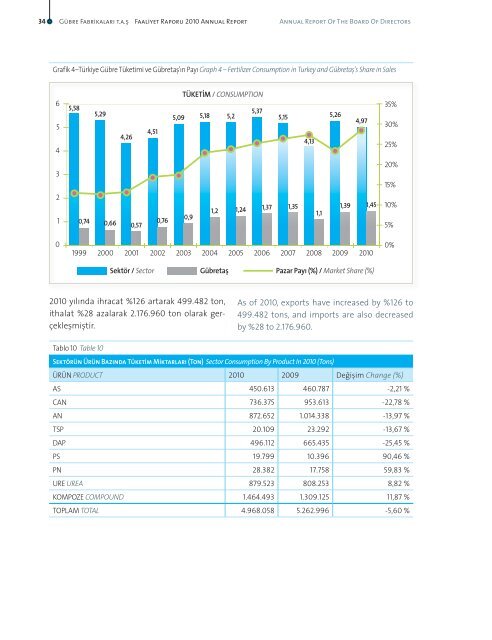
34 <strong>Gübre</strong> <strong>Fabrikaları</strong> t.a.ş Faaliyet Raporu 2010 Annual Report Annual Report Of The Board Of DırectorsGrafik 4–Türkiye <strong>Gübre</strong> Tüketimi ve <strong>Gübre</strong>taş’ın Payı Graph 4 – Fertilizer Consumption in Turkey and <strong>Gübre</strong>taş’s Share in Sales6545,585,294,264,51TÜKETİM / CONSUMPTION5,375,09 5,18 5,25,154,135,264,9735%30%25%320%15%210,740,660,570,760,91,21,241,371,351,11,391,4510%5%01999 2000 2001 2002 2003 2004 2005 2006 2007 2008 2009 2010Sektör / Sector <strong>Gübre</strong>taş Pazar Payı (%) / Market Share (%)0%2010 yılında ihracat %126 artarak 499.482 ton,ithalat %28 azalarak 2.176.960 ton olarak gerçekleşmiştir.As of 2010, exports have increased by %126 to499.482 tons, and imports are also decreasedby %28 to 2.176.960.Tablo 10 Table 10Sektörün Ürün Bazında Tüketim Miktarları (Ton) Sector Consumption By Product In 2010 (Tons)ÜRÜN PRODUCT 2010 2009 Değişim Change (%)AS 450.613 460.787 -2,21 %CAN 736.375 953.613 -22,78 %AN 872.652 1.014.338 -13,97 %TSP 20.109 23.292 -13,67 %DAP 496.112 665.435 -25,45 %PS 19.799 10.396 90,46 %PN 28.382 17.758 59,83 %URE UREA 879.523 808.253 8,82 %KOMPOZE COMPOUND 1.464.493 1.309.125 11,87 %TOPLAM TOTAL 4.968.058 5.262.996 -5,60 %