Flavoured_Milk_Free
The backdrop to the UK flavoured milk market is one of relentless change. The removal of the EU milk quotas, the transition by emerging economies to a Western-style diet, the upcoming introduction of the ‘sugar tax’ and the booming sports nutrition industry are all aspects of change that create both challenges and opportunities for the UK flavoured milk market. HRA Food and Drink has developed this report as a map to guide industry stakeholders. Although volume growth in 2014 was slightly lower than in previous years, the flavoured milk market still has plenty of room for product innovation in the future.
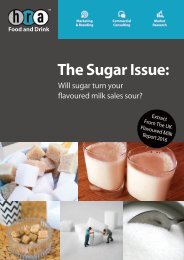
The backdrop to the UK flavoured milk market is one of relentless change. The removal of the EU milk quotas, the transition by emerging economies to a Western-style diet, the upcoming introduction of the ‘sugar tax’ and the booming sports nutrition industry are all aspects of change that create both challenges and opportunities for the UK flavoured milk market.
HRA Food and Drink has developed this report as a map to guide industry stakeholders. Although volume growth in 2014 was slightly lower than in previous years, the flavoured milk market still has plenty of room for product innovation in the future.

Create successful ePaper yourself
Turn your PDF publications into a flip-book with our unique Google optimized e-Paper software.
UK FLAVOURED MILK MARKET 2017 & BEYOND<br />
8.4 Current UK Sugar Consumption<br />
To view please<br />
purchase full report<br />
Figure 8.5: Understanding the difference between intrinsic and extrinsic sugars<br />
Most of the debate focuses on the effects of ‘non-milk extrinsic sugars’ (NMES), with some<br />
analysts making a distinction between ‘good’ sugars and ‘bad’ sugars in the same way that<br />
‘good’ and ‘bad’ fats are described.<br />
8.4.1 Historic per capita consumption of NMES in the UK (1704-2012)<br />
To view please<br />
purchase full report<br />
Figure 8.6: Historic annual per capita consumption of NMES sugars in the UK (kg) –<br />
1704 to 2012<br />
Since the Victorian era, annual per capita consumption of NMES sugars in the UK has been<br />
rising, reaching a peak in the 1970s. Since 1996, efforts in product reformulation have led<br />
to a decrease of annual per capita consumption of NMES.<br />
However, annual per capita consumption of NMES continues to be higher than the<br />
recommended daily average for most UK adults and children.<br />
141<br />
© 2016 Teepee Limited. All Rights Reserved.