Flavoured_Milk_Free
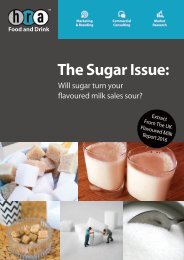
The backdrop to the UK flavoured milk market is one of relentless change. The removal of the EU milk quotas, the transition by emerging economies to a Western-style diet, the upcoming introduction of the ‘sugar tax’ and the booming sports nutrition industry are all aspects of change that create both challenges and opportunities for the UK flavoured milk market. HRA Food and Drink has developed this report as a map to guide industry stakeholders. Although volume growth in 2014 was slightly lower than in previous years, the flavoured milk market still has plenty of room for product innovation in the future.
The backdrop to the UK flavoured milk market is one of relentless change. The removal of the EU milk quotas, the transition by emerging economies to a Western-style diet, the upcoming introduction of the ‘sugar tax’ and the booming sports nutrition industry are all aspects of change that create both challenges and opportunities for the UK flavoured milk market.
HRA Food and Drink has developed this report as a map to guide industry stakeholders. Although volume growth in 2014 was slightly lower than in previous years, the flavoured milk market still has plenty of room for product innovation in the future.
You also want an ePaper? Increase the reach of your titles
YUMPU automatically turns print PDFs into web optimized ePapers that Google loves.
UK FLAVOURED MILK MARKET 2017 & BEYOND<br />
To view please<br />
purchase full report<br />
Figure 8.12: Adults aged 65+<br />
• Teenagers (11 to 18 years of age) where found to consume most sugar. Adults over 65<br />
were found to consume the least sugar. Males consumed more sugar per capita across<br />
all age groups.<br />
• Infants, children and teenagers consume most of their sugar in soft drinks, followed by<br />
sugar, sweets and jam. Adults in both age categories consumed most of their sugar in<br />
sugar, sweets & jams, followed by soft drinks.<br />
• Children between the ages of 1 to 3 consume the most dairy derived sugar, with 19%<br />
of their sugar consumption coming from milk<br />
• Children between the ages of 4 to 10 derive 14% of their sugar intake from dairy<br />
sources.<br />
• Adults derive least amount of sugar from dairy sources, with only 8% of NMES coming<br />
from milk products.<br />
8.5 Comparative sugar content of sweetened drinks<br />
There is a wide variation of sugar levels within flavoured milk. Whilst carbonated drinks<br />
contain the highest levels of sugar, flavoured milks are not far behind, making them targets<br />
for sugar campaigners.<br />
143<br />
© 2016 Teepee Limited. All Rights Reserved.


