

POLLINATORS POLLINATION AND FOOD PRODUCTION
individual_chapters_pollination_20170305
individual_chapters_pollination_20170305

You also want an ePaper? Increase the reach of your titles
YUMPU automatically turns print PDFs into web optimized ePapers that Google loves.
THE ASSESSMENT REPORT ON <strong>POLLINATORS</strong>, <strong>POLLINATION</strong> <strong>AND</strong> <strong>FOOD</strong> <strong>PRODUCTION</strong><br />
determine land cover, which can be logistically impeditive<br />
at national and global scales. Finally, the spatially explicit<br />
information available for valuation is usually obtained from<br />
censuses and aggregated at municipality, state or national<br />
levels by national bureaus of statistics, a procedure that per<br />
se causes some loss of information (Vermaat et al., 2005).<br />
Furthermore, increasing the spatial scale means using data<br />
collected by different researchers or agencies using distinct<br />
protocols, which frequently are not directly comparable<br />
(Lautenbach et al., 2012, Leonhardt et al., 2013). By<br />
contrast, GIS data are gathered by pixel or cell. Inserting<br />
such reported administrative data (crop type, production<br />
area, yields) into mapped units frequently involves several<br />
calculation steps and many assumptions (Monfreda et al.,<br />
2008) that may decrease estimate accuracy at large scales.<br />
Some studies used GIS to calculate pollination service<br />
value at the local (including landscape) scale (Lonsdorf<br />
et al., 2009, Ricketts and Lonsdorf, 2013), but the most<br />
comprehensive attempt to map pollination benefits at the<br />
global scale was conducted by Lautenbach et al. (2012).<br />
These authors used the geographic distribution of crop<br />
areas and crop yields made by Monfreda et al. (2008) with<br />
latitude-longitude grid cells of 5 minutes x 5 minutes made<br />
possible by the use of the use of satellite. Despite the fine<br />
resolution (approximately 10 km x 10 km at the equator),<br />
this approach has some limitations, because the distribution<br />
of yield statistics into raster cells (i.e., a grid containing<br />
values that represent information) eliminates some crops<br />
for such cells (Lautenbach et al., 2012). Thus, accurate<br />
estimates of pollination benefits at national and global scales<br />
can be strongly influenced by evolving low-cost satellite<br />
technology to distinguish different crop types, and countries’<br />
adoption of standardized frameworks to collect crop data<br />
(e.g., Vaissière et al., 2011; Ne’eman et al., 2010).<br />
An alternative to the lack of detailed data for pollination<br />
valuation at larger scales is the use of benefit or value<br />
transfer-based mapping (Troy and Wilson, 2006; Eigenbrod<br />
et al., 2010). This procedure consists of determining the<br />
value of the pollination service for a given crop type at<br />
a local scale, and using this as a proxy to estimate the<br />
value of the same crop type at other locations or at the<br />
regional or national scale. However, this procedure has<br />
several limitations related to the lack of correspondence<br />
between locations (Troy and Wilson, 2006; Plummer, 2009;<br />
Eigenbrod et al., 2010), leading to generalization errors<br />
that can only be overcome with improved spatial data and<br />
increasing the number of local replicates used for calculating<br />
the value of pollination services. A review of spatially<br />
explicit tools for pollination service valuation is available in<br />
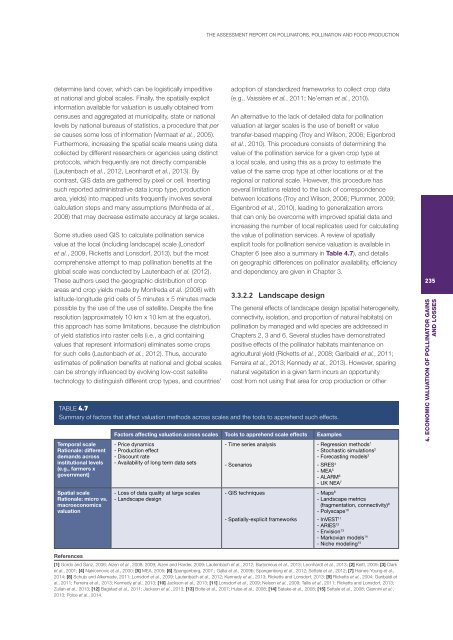
Chapter 6 (see also a summary in Table 4.7), and details<br />
on geographic differences on pollinator availability, efficiency<br />
and dependency are given in Chapter 3.<br />
3.3.2.2 Landscape design<br />
The general effects of landscape design (spatial heterogeneity,<br />
connectivity, isolation, and proportion of natural habitats) on<br />
pollination by managed and wild species are addressed in<br />
Chapters 2, 3 and 6. Several studies have demonstrated<br />
positive effects of the pollinator habitats maintenance on<br />
agricultural yield (Ricketts et al., 2008; Garibaldi et al., 2011;<br />
Ferreira et al., 2013; Kennedy et al., 2013). However, sparing<br />
natural vegetation in a given farm incurs an opportunity<br />
cost from not using that area for crop production or other<br />
TABLE 4.7<br />
Summary of factors that affect valuation methods across scales and the tools to apprehend such effects.<br />
Temporal scale<br />
Rationale: different<br />
demands across<br />
institutional levels<br />
(e.g., farmers x<br />
government)<br />
Spatial scale<br />
Rationale: micro vs.<br />
macroeconomics<br />
valuation<br />
Factors affecting valuation across scales Tools to apprehend scale effects Examples<br />
- Price dynamics<br />
- Production effect<br />
- Discount rate<br />
- Availability of long term data sets<br />
- Loss of data quality at large scales<br />
- Landscape design<br />
- Time series analysis<br />
- Scenarios<br />
- GIS techniques<br />
- Spatially-explicit frameworks<br />
- Regression methods 1<br />
- Stochastic simulations 2<br />
- Forecasting models 3<br />
- SRES 4<br />
- MEA 5<br />
- ALARM 6<br />
- UK NEA 7<br />
- Maps 8<br />
- Landscape metrics<br />
(fragmentation, connectivity) 9<br />
- Polyscape 10<br />
- InVEST 11<br />
- ARIES 12<br />
- Envision 13<br />
- Markovian models 14<br />
- Niche modeling 15<br />
235<br />
4. ECONOMIC VALUATION OF POLLINATOR GAINS<br />
<strong>AND</strong> LOSSES<br />
References<br />
[1] Gordo and Sanz, 2006; Aizen et al., 2008; 2009; Aizen and Harder, 2009; Lautenbach et al., 2012; Bartomeus et al., 2013; Leonhardt et al., 2013; [2] Keitt, 2009; [3] Clark<br />
et al., 2001; [4] Nakicenovic et al., 2000; [5] MEA, 2005; [6] Spangenberg, 2007 ; Gallai et al., 2009b; Spangenberg et al., 2012; Settele et al., 2012; [7] Haines-Young et al.,<br />
2014; [8] Schulp and Alkemade, 2011; Lonsdorf et al., 2009; Lautenbach et al., 2012; Kennedy et al., 2013; Ricketts and Lonsdorf, 2013; [9] Ricketts et al., 2004; Garibaldi et<br />
al., 2011; Ferreira et al., 2013; Kennedy et al., 2013; [10] Jackson et al., 2013; [11] Lonsdorf et al., 2009; Nelson et al., 2009; Tallis et al., 2011; Ricketts and Lonsdorf, 2013;<br />
Zulian et al., 2013; [12] Bagstad et al., 2011; Jackson et al., 2013; [13] Bolte et al., 2007; Hulse et al., 2008; [14] Satake et al., 2008; [15] Settele et al., 2008; Giannini et al.,<br />
2013; Polce et al., 2014.