

POLLINATORS POLLINATION AND FOOD PRODUCTION
individual_chapters_pollination_20170305
individual_chapters_pollination_20170305

Create successful ePaper yourself
Turn your PDF publications into a flip-book with our unique Google optimized e-Paper software.
THE ASSESSMENT REPORT ON <strong>POLLINATORS</strong>, <strong>POLLINATION</strong> <strong>AND</strong> <strong>FOOD</strong> <strong>PRODUCTION</strong><br />
240<br />
4. ECONOMIC VALUATION OF POLLINATOR GAINS<br />
<strong>AND</strong> LOSSES<br />
Data Required: Measures of all relevant assets and their<br />
distribution within a region at a spatially explicit scale.<br />
4.3.3 Resilience stock<br />
What it Measures: The monetary value of resilience (the<br />
capacity of the pollinator community to withstand and<br />
recover from pressures that affect its capacity to provide<br />
benefits).<br />
Methodology: This method assesses the long-term<br />
trade-offs and benefits from different managements on<br />
service availability by considering resilience (Section 4.1.)<br />
as a separate asset that can be affected by pressures and<br />
mitigations (Maler et al., 2009). The impacts of a pressure<br />
or mitigation on resilience can be measured as a change<br />
in the marginal shadow values of the service (Bateman et<br />
al., 2011). Shadow values represent the long-term benefits<br />
of ecosystem services from natural capital to society,<br />
including their potential future values. The shadow value<br />
of an ecosystem service can be estimated by applying a<br />
discount rate (see Section 3.2.2.3) to estimates of the future<br />
value of the ecosystem services generated by the capital<br />
asset; e.g., the value of pollination services now and in the<br />
future assuming similar land use. The resilience of pollination<br />
services to crops and wildflowers will be influenced by<br />
the abundance and diversity of key functional pollinators<br />
(Winfree and Kremen, 2009). Higher abundances of key<br />
species and a higher diversity of potential service providers<br />
will increase resilience by increasing the community’s<br />
capacity to adapt to change (e.g., Brittain et al., 2013).<br />
Thresholds for resilience, the point at which an asset would<br />
be unable to return to its original state if a pressure were to<br />
degrade its functioning, will therefore be the point at which<br />
a pollinator community is unable provide services following<br />
a reduction in a key species or group. These thresholds are<br />
presently unknown, although ecological network analyses<br />
may provide a starting point for future evaluation.<br />
Strengths: The economic value of resilience as a stock<br />
inherently captures the value of insurance; the mitigating<br />
effect of resilience upon producer wellbeing, which can<br />
be estimated separately utilizing specialized models<br />
(Baumgartner and Strunz, 2014). As a capital asset it can<br />
be readily incorporated where monetary markets for crops<br />
are absent, with the shadow value simply becoming the<br />
projected stock of the resilience asset.<br />
Weaknesses: This method is highly influenced by the<br />
discount rate applied to create the shadow value. In the<br />
case of pollination services, this will depend on both the<br />
projected future benefits and, for crop pollination, the<br />
discounted price of the crop in future periods. These<br />
prices are likely to be very difficult to project and discount<br />
rates can be very difficult to estimate (Section 3.2.2.3). By<br />
applying this method to a single ecosystem service, this<br />
method may over-state the impacts of pollinator gains<br />
and losses in isolation. In reality, ecosystem services and<br />
inputs may compensate for one another (e.g., pollination<br />
services increasing yield in certain oilseed rape, Brassica<br />
napus, varieties in the absence of fertilizer – Marini et al.,<br />
2015), necessitating a complex, whole systems approach<br />
that considers multiple services in a single resilience stock.<br />
Insurance values are inherently linked to user preferences for<br />
risk aversion, such as the maximum amount of pollinatordependent<br />
yield loss a producer is willing to accept before<br />
switching crops (e.g., Gordon and Davis, 2003), which<br />
should be estimated separately to extrapolate insurance<br />
value (Baumgartner and Strunz, 2014). Most critically,<br />
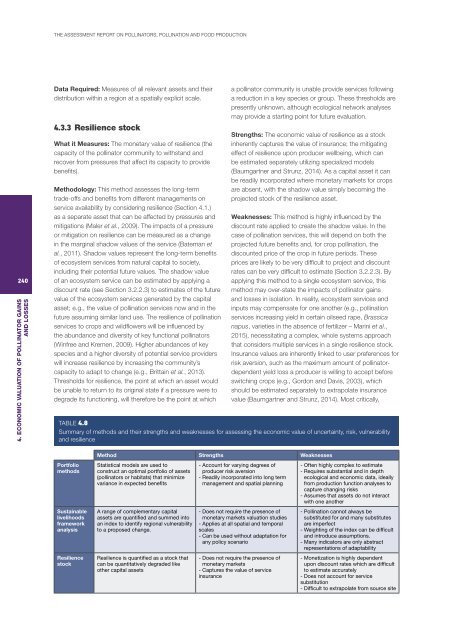
TABLE 4.8<br />
Summary of methods and their strengths and weaknesses for assessing the economic value of uncertainty, risk, vulnerability<br />
and resilience<br />
Portfolio<br />
methods<br />
Sustainable<br />
livelihoods<br />
framework<br />
analysis<br />
Resilience<br />
stock<br />
Method Strengths Weaknesses<br />
Statistical models are used to<br />
construct an optimal portfolio of assets<br />
(pollinators or habitats) that minimize<br />
variance in expected benefits<br />
A range of complementary capital<br />
assets are quantified and summed into<br />
an index to identify regional vulnerability<br />
to a proposed change.<br />
Resilience is quantified as a stock that<br />
can be quantitatively degraded like<br />
other capital assets<br />
- Account for varying degrees of<br />
producer risk aversion<br />
- Readily incorporated into long term<br />
management and spatial planning<br />
- Does not require the presence of<br />
monetary markets valuation studies<br />
- Applies at all spatial and temporal<br />
scales<br />
- Can be used without adaptation for<br />
any policy scenario<br />
- Does not require the presence of<br />
monetary markets<br />
- Captures the value of service<br />
insurance<br />
- Often highly complex to estimate<br />
- Requires substantial and in depth<br />
ecological and economic data, ideally<br />
from production function analyses to<br />
capture changing risks<br />
- Assumes that assets do not interact<br />
with one another<br />
- Pollination cannot always be<br />
substituted for and many substitutes<br />
are imperfect<br />
- Weighting of the index can be difficult<br />
and introduce assumptions.<br />
- Many indicators are only abstract<br />
representations of adaptability<br />
- Monetization is highly dependent<br />
upon discount rates which are difficult<br />
to estimate accurately<br />
- Does not account for service<br />
substitution<br />
- Difficult to extrapolate from source site