BOOKS OF RtfiDIfGS - PAHO/WHO
BOOKS OF RtfiDIfGS - PAHO/WHO
BOOKS OF RtfiDIfGS - PAHO/WHO

Create successful ePaper yourself
Turn your PDF publications into a flip-book with our unique Google optimized e-Paper software.
ing of the same patient mix and arrival times. Each day<br />
was repeated 10 times for random service time, with the<br />
same expectations concening random personnel characteristics<br />
(dressing time, transportation time, etc.). Thus,<br />
for cach one of the seven scheduling procedures, there<br />
were:<br />
4 days x 160 dPai'y x 10 repetitions = 6400 patients.<br />
day<br />
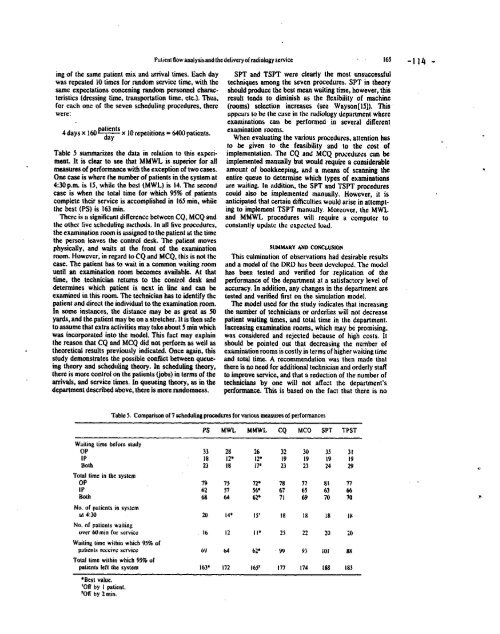
Table 5 summarizes the data in relation to this experiment.<br />
It is clear to see that MMWL is superior for all<br />
measures of performance with the exception of two cases.<br />
One case is where the number of patients in the system at<br />
4:30p.m. is 15, while the best (MWL) is 14. The second<br />
case is when the total time for which 95% of patients<br />
complete their service is accomplished in 165 min, while<br />
the best (PS) is 163 min.<br />
Therc is a significant differcncc between CQ, MCQ and<br />
the uther five scheduling methods. In all five procedures,<br />
the examinalion room is assigned to the patient at the time<br />
the person leaves the control desk. The patient moves<br />
physically, and waits at the front of the examination<br />
room. Howcvcr, in rega.rd lo CQ and MCQ, this is not thc<br />
case. The patient has to wait in a common waiting room<br />
until an examination room becomes available. At that<br />
time, the technician returns to the control desk and<br />
determines which patient is next in line and can be<br />
examined in this room. The technician has to identify the<br />
patient and direct the individual to the examination room.<br />
In some instances, the distance may be as great as 50<br />
yards, and the patient may be on a stretcher. It is then safe<br />
to assume that extra activities may take about 5 min which<br />
was incorporated into the model. This fact may explain<br />
the reason that CQ and MCQ did not perform as weil as<br />
theoretical results previously indicated. Once again, this<br />
study demonstrates the possible conflict between queueing<br />
theory and scheduling theory. In scheduling theory,<br />
there is more control on the patients (jobs) in terms of the<br />
arrivais, and service times. In queueing theory, as in the<br />
department described above, there is more randomness.<br />
Waiting time before study<br />
OP<br />
IP<br />
Both<br />
Total time in thce system<br />
OP<br />
IP<br />
Both<br />
No. of patients in system<br />
at 4:30<br />
No. of patients waiting<br />
over 60 min for scrvice<br />
Patient flow analysis and the delivery of radiology service<br />
SPT and TSPT were clearly the most unsuccessful<br />
techniques among the seven procedures. SPT in theory<br />
should produce the best mean waiting time, however, this<br />
result tends to diminish as the flexibility of machine<br />
(rooms) selection increases (see Waysont15]). This<br />
appcars to be the case in the radiology department where<br />
examinations can be performed in several different<br />
examination rooms.<br />
When evaluating the various procedures, attention has<br />
to be given to the feasibility and to the cost of<br />
implementation. The CQ and MCQ procedures can be<br />
implemented manually but would require a considerable<br />
amount of bookkeeping, and a means of scanning the<br />
entire queue to determine which types of examinations<br />
are waiting. In addition, the SPT and TSPT procedures<br />
could also be implemented manually. However, it is<br />
anticipated that certain difficulties would arise in attempting<br />
to implement TSPT manually. Moreover, the MWL<br />
and MMWL procedures will require a computer to<br />
constantly update the expected luad.<br />
SUMMARY AND CONCLUSION<br />
This culmination of observations had desirable results<br />
and a model of the DRD has been developed. The model<br />
has been tested and verified for replication of the<br />
performance of the department at a satisfactory level of<br />
accuracy. In addition, any changes in the department are<br />
tested and verified first on the simulation model.<br />
The model used for the study indicates that increasing<br />
the number of technicians or orderlies will not decrease<br />
patient waiting times, and total time in the department.<br />
Increasing examination rooms, which may be promising,<br />
was considered and rejected because of high costs. It<br />
should be pointed out that decreasing the number of<br />
examination rooms is costly in terms of higher waiting time<br />
and total time. A recommendation was then made that<br />
there is no need for additional technician and orderly staff<br />
to improve service, and that a reduction of the number of<br />
technicians by one will not affect the department's<br />
performance. This is based on the fact that there is no<br />
Table 5. Comparison of 7 scheduling procedures for various measures of performances<br />
Waiting time within which 95% of<br />
palienis reccive scrvice<br />
Total time within which 95% of<br />
patients left the system<br />
'Best value.<br />
'Off by I patient.<br />
'Off by 2 min.<br />
PS MWL MMWL CQ MCO SPT TPST<br />
33<br />
18<br />
23<br />
79<br />
62<br />
68<br />
28<br />
12*<br />
18<br />
75<br />
57<br />
64<br />
26<br />
12'<br />
17*<br />
72*<br />
56'<br />
62'<br />
32<br />
19<br />
23<br />
78<br />
67<br />
71<br />
30<br />
19<br />
23<br />
77<br />
65<br />
69<br />
35<br />
19<br />
24<br />
81<br />
63<br />
70<br />
31<br />
19<br />
29<br />
77<br />
66<br />
70<br />
20 14* 15' 18 18 18 18<br />
16 12 II1' 25 22 20 20<br />
69 64 62* ' 99 93 101 88<br />
163' 172 1652 177 174 188 183<br />
165 -14 -