Pontificia Universidad Católica de Chile Facultad de Educación ...
Pontificia Universidad Católica de Chile Facultad de Educación ...
Pontificia Universidad Católica de Chile Facultad de Educación ...

Create successful ePaper yourself
Turn your PDF publications into a flip-book with our unique Google optimized e-Paper software.
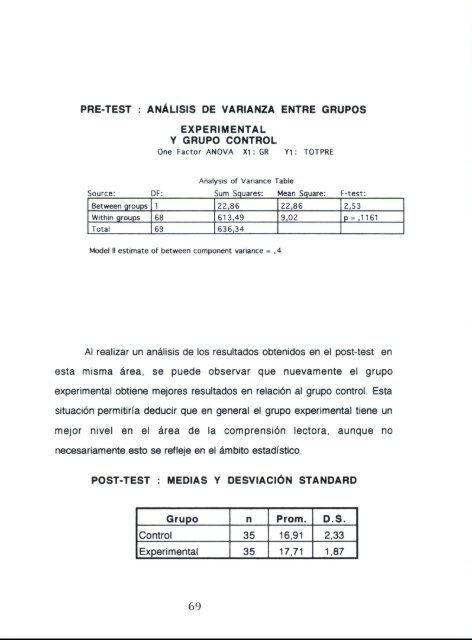
PRE-TEST : ANÁLISIS DE VARIANZA ENTRE GRUPOS<br />
EXPERIMENTAL<br />
Y GRUPO CONTROL<br />
One Factor ANOVA Xl: GR Yl: TOTPRE<br />
Analysis of Variance Table<br />
Sotirc: DF: Siim Sciijarpç: Mean Scitiare: F-rest:<br />
Between groups 1 22,86 22,86 12,53<br />
Within groups 68 613,49 9,02 p = ,1161<br />
Total 69 636,34<br />
Mo<strong>de</strong>l O estimate of between component variance = , 4<br />
Al realizar un análisis <strong>de</strong> los resultados obtenidos en el post-test en<br />
esta misma área, se pue<strong>de</strong> observar que nuevamente el grupo<br />
experimental obtiene mejores resultados en relación al grupo control. Esta<br />
situación permitiría <strong>de</strong>ducir que en general el grupo experimental tiene un<br />
mejor nivel en el área <strong>de</strong> la comprensión lectora, aunque no<br />
necesariamente esto se refleje en el ámbito estadístico.<br />
POST-TEST : MEDIAS Y DESVIACIÓN STANDARD<br />
Grupo n Prom. D.S.<br />
Control 35 16,91 2,33<br />
Experimental 35 1771 1,87<br />
69