Fresh Point Magazine - B2B24 - Il Sole 24 Ore
Fresh Point Magazine - B2B24 - Il Sole 24 Ore
Fresh Point Magazine - B2B24 - Il Sole 24 Ore

You also want an ePaper? Increase the reach of your titles
YUMPU automatically turns print PDFs into web optimized ePapers that Google loves.
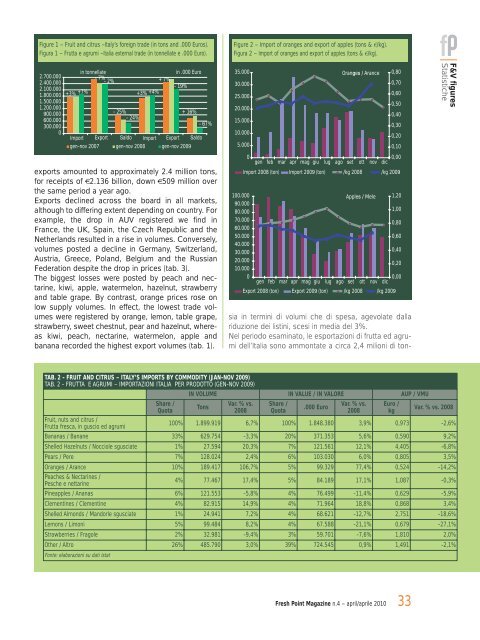
Figure 1 – Fruit and citrus –Italy’s foreign trade (in tons and .000 Euros).<br />
Figura 1 – Frutta e agrumi –Italia external trade (in tonnellate e .000 Euro).<br />
2.700.000<br />
2.400.000<br />
2.100.000<br />
1.800.000<br />
1.500.000<br />
1.200.000<br />
900.000<br />
600.000<br />
300.000<br />
0<br />
+3% +7%<br />
in tonnellate<br />
- 7%<br />
- 2%<br />
- 25%<br />
- <strong>24</strong>%<br />
+3% +4%<br />
+ 7%<br />
in .000 Euro<br />
- 19%<br />
+ 16%<br />
Import Export Saldo Import Export Saldo<br />
gen-nov 2007 gen-nov 2008 gen-nov 2009<br />
- 67%<br />
exports amounted to approximately 2.4 million tons,<br />
for receipts of €2.136 billion, down €509 million over<br />
the same period a year ago.<br />
Exports declined across the board in all markets,<br />
although to differing extent depending on country. For<br />
example, the drop in AUV registered we find in<br />
France, the UK, Spain, the Czech Republic and the<br />
Netherlands resulted in a rise in volumes. Conversely,<br />
volumes posted a decline in Germany, Switzerland,<br />
Austria, Greece, Poland, Belgium and the Russian<br />
Federation despite the drop in prices (tab. 3).<br />
The biggest losses were posted by peach and nectarine,<br />
kiwi, apple, watermelon, hazelnut, strawberry<br />
and table grape. By contrast, orange prices rose on<br />
low supply volumes. In effect, the lowest trade volumes<br />
were registered by orange, lemon, table grape,<br />
strawberry, sweet chestnut, pear and hazelnut, whereas<br />
kiwi, peach, nectarine, watermelon, apple and<br />
banana recorded the highest export volumes (tab. 1).<br />
Figure 2 – Import of oranges and export of apples (tons & €/kg).<br />
Figura 2 – Import of oranges and export of apples (tons & €/kg).<br />
35.000<br />
30.000<br />
25.000<br />
20.000<br />
15.000<br />
10.000<br />
5.000<br />
0<br />
100.000<br />
90.000<br />
80.000<br />
70.000<br />
60.000<br />
50.000<br />
40.000<br />
30.000<br />
20.000<br />
10.000<br />
0<br />
Oranges / Arance<br />
gen feb mar apr mag giu lug ago set ott nov dic 0,00<br />
sia in termini di volumi che di spesa, agevolate dalla<br />
riduzione dei listini, scesi in media del 3%.<br />
Nel periodo esaminato, le esportazioni di frutta ed agrumi<br />
dell’Italia sono ammontate a circa 2,4 milioni di ton-<br />
<strong>Fresh</strong> <strong>Point</strong> <strong>Magazine</strong> n.4 – april/aprile 2010<br />
0,80<br />
0,70<br />
0,60<br />
0,50<br />
0,40<br />
0,30<br />
0,20<br />
0,10<br />
Import 2008 (ton) Import 2009 (ton) /kg 2008 /kg 2009<br />
Apples / Mele<br />
1,20<br />
1,00<br />
0,80<br />
0,60<br />
0,40<br />
0,20<br />
gen feb mar apr mag giu lug ago set ott nov dic 0,00<br />
Export 2008 (ton) Export 2009 (ton) /kg 2008 /kg 2009<br />
TAB. 2 - FRUIT AND CITRUS – ITALY’S IMPORTS BY COMMODITY (JAN-NOV 2009)<br />
TAB. 2 - FRUTTA E AGRUMI – IMPORTAZIONI ITALIA PER PRODOTTO (GEN-NOV 2009)<br />
IN VOLUME IN VALUE / IN VALORE AUP / VMU<br />
Share /<br />
Quota<br />
Tons<br />
Var. % vs.<br />
2008<br />
Share /<br />
Quota<br />
.000 Euro<br />
Var. % vs.<br />
2008<br />
Euro /<br />
kg<br />
33<br />
F&V figures<br />
Statistiche<br />
Var. % vs. 2008<br />
Fruit, nuts and citrus /<br />
Frutta fresca, in guscio ed agrumi<br />
100% 1.899.919 6,7% 100% 1.848.380 3,9% 0,973 -2,6%<br />
Bananas / Banane 33% 629.754 -3,3% 20% 371.353 5,6% 0,590 9,2%<br />
Shelled Hazelnuts / Nocciole sgusciate 1% 27.594 20,3% 7% 121.561 12,1% 4,405 -6,8%<br />
Pears / Pere 7% 128.0<strong>24</strong> 2,4% 6% 103.030 6,0% 0,805 3,5%<br />
Oranges / Arance 10% 189.417 106,7% 5% 99.329 77,4% 0,5<strong>24</strong> -14,2%<br />
Peaches & Nectarines /<br />
Pesche e nettarine<br />
4% 77.467 17,4% 5% 84.189 17,1% 1,087 -0,3%<br />
Pineapples / Ananas 6% 121.553 -5,8% 4% 76.499 -11,4% 0,629 -5,9%<br />
Clementines / Clementine 4% 82.915 14,9% 4% 71.964 18,8% 0,868 3,4%<br />
Shelled Almonds / Mandorle sgusciate 1% <strong>24</strong>.941 7,2% 4% 68.621 -12,7% 2,751 -18,6%<br />
Lemons / Limoni 5% 99.484 8,2% 4% 67.588 -21,1% 0,679 -27,1%<br />
Strawberries / Fragole 2% 32.981 -9,4% 3% 59.701 -7,6% 1,810 2,0%<br />
Other / Altro<br />
Fonte: elaborazioni su dati Istat<br />
26% 485.790 3,0% 39% 7<strong>24</strong>.545 0,9% 1,491 -2,1%