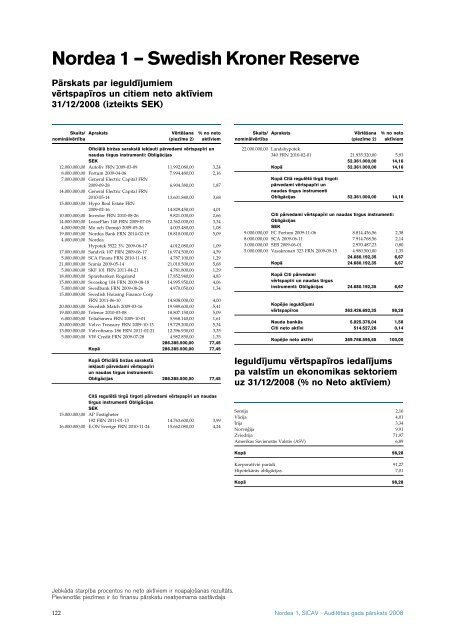
<strong>Nordea</strong> 1 – Swedish Kroner ReservePārskats par ieguldījumiemvērtspapīros un citiem neto aktīviem31/12/<strong>2008</strong> (izteikts SEK)Skaits/ AprakstsnominālvērtībaVērtēšana(piezīme 2)% no netoaktīviemSkaits/ AprakstsnominālvērtībaVērtēšana(piezīme 2)% no netoaktīviemOficiālā biržas sarakstā iekļauti pārvedami vērtspapīri unnaudas tirgus instrumenti: ObligācijasSEK12.000.000,00 Autoliv FRN 2009-03-09 11.992.080,00 3,248.000.000,00 Fortum 2009-04-06 7.994.480,00 2,167.000.000,00 General Electric Capital FRN2009-09-28 6.904.380,00 1,8714.000.000,00 General Electric Capital FRN2010-05-14 13.601.840,00 3,6815.000.000,00 Hypo Real Estate FRN2009-02-16 14.829.450,00 4,0110.000.000,00 Investor FRN 2010-08-26 9.821.000,00 2,6614.000.000,00 LeasePlan 140 FRN 2009-07-05 12.362.000,00 3,344.000.000,00 Mo och Domsjö 2009-05-26 4.003.480,00 1,0819.000.000,00 <strong>Nordea</strong> <strong>Bank</strong> FRN 2014-02-19 18.810.000,00 5,094.000.000,00 <strong>Nordea</strong>Hypotek 5522 3% 2009-06-17 4.012.080,00 1,0917.000.000,00 Sandvik 107 FRN 2009-06-17 16.974.500,00 4,595.000.000,00 SCA Finans FRN 2010-11-18 4.787.100,00 1,2921.000.000,00 Scania 2009-05-14 21.010.500,00 5,685.000.000,00 SKF 101 FRN 2011-04-21 4.781.800,00 1,2918.000.000,00 Sparebanken Rogaland 17.852.940,00 4,8315.000.000,00 Sveaskog 104 FRN 2009-08-18 14.995.950,00 4,065.000.000,00 Swedbank FRN 2009-08-26 4.970.050,00 1,3415.000.000,00 Swedish Housing Finance CorpFRN 2011-06-10 14.808.000,00 4,0020.000.000,00 Swedish Match 2009-03-16 19.989.600,00 5,4119.000.000,00 Telenor 2010-03-08 18.807.150,00 5,096.000.000,00 TeliaSonera FRN 2009-10-01 5.968.140,00 1,6120.000.000,00 Volvo Treasury FRN 2009-10-13 19.729.200,00 5,3413.000.000,00 Volvofinans 186 FRN 2011-02-21 12.396.930,00 3,355.000.000,00 VW Credit FRN 2009-07-28 4.982.850,00 1,35286.385.500,00 77,45Kopā 286.385.500,00 77,45Kopā Oficiālā biržas sarakstāiekļauti pārvedami vērtspapīriun naudas tirgus instrumenti:Obligācijas 286.385.500,00 77,45Citā regulētā tirgū tirgoti pārvedami vērtspapīri un naudastirgus instrumenti ObligācijasSEK15.000.000,00 AP Fastigheter192 FRN 2011-01-13 14.763.600,00 3,9916.000.000,00 E.ON Sverige FRN 2010-11-24 15.662.080,00 4,2422.000.000,00 Landshypotek340 FRN 2010-02-01 21.935.320,00 5,9352.361.000,00 14,16Kopā 52.361.000,00 14,16Kopā Citā regulētā tirgū tirgotipārvedami vērtspapīri unnaudas tirgus instrumentiObligācijas 52.361.000,00 14,16Citi pārvedami vērtspapīri un naudas tirgus instrumenti:ObligācijasSEK9.000.000,00 FC Fortum 2009-11-06 8.814.436,56 2,388.000.000,00 SCA 2009-06-11 7.914.768,56 2,143.000.000,00 SEB 2009-06-01 2.970.487,23 0,805.000.000,00 Vasakronan 323 FRN 2009-09-15 4.980.500,00 1,3524.680.192,35 6,67Kopā 24.680.192,35 6,67Kopā Citi pārvedamivērtspapīri un naudas tirgusinstrumenti: Obligācijas 24.680.192,35 6,67Kopējie ieguldījumivērtspapīros 363.426.692,35 98,28Nauda bankās 5.825.376,04 1,58Citi neto aktīvi 514.527,26 0,14Kopējie neto aktīvi 369.766.595,65 100,00Ieguldījumu vērtspapīros iedalījumspa valstīm un ekonomikas sektoriemuz 31/12/<strong>2008</strong> (% no Neto aktīviem)Somija 2,16Vācija 4,01Īrija 3,34Norvēg‘ ija 9,91Zviedrija 71,97Amerikas Savienotās Valstis (ASV) 6,89Kopā 98,28Korporatīvie parādi 91,27Hipotekārās obligācijas 7,01Kopā 98,28Jebkāda starpība procentos no neto aktīviem ir noapaļošanas rezultāts.Pievienotās piezīmes ir šo finansu pārskatu neatņemama sastāvdaļa122 <strong>Nordea</strong> 1, <strong>SICAV</strong> ˙ Auditētais <strong>gada</strong> pārskats <strong>2008</strong>
<strong>Nordea</strong> 1 – US High Yield Bond FundPārskats par ieguldījumiemvērtspapīros un citiem neto aktīviem31/12/<strong>2008</strong> (izteikts USD)Skaits/ AprakstsnominālvērtībaVērtēšana(piezīme 2)% no netoaktīviemSkaits/ AprakstsnominālvērtībaVērtēšana(piezīme 2)% no netoaktīviemOficiālā biržas sarakstā iekļauti pārvedami vērtspapīri unnaudas tirgus instrumenti: ObligācijasUSD255.000,00 Aleris International 9%2014-12-15 15.300,00 0,04815.000,00 Alliant Techsystems 6.750%2016-04-01 725.350,00 1,89855.000,00 Allied Waste North5.75%2011-02-15 801.562,50 2,09250.000,00 American Airlines 7.377%2019-05-23 52.109,97 0,14380.000,00 American Railcar Industries7.5% 2014-03-01 250.800,00 0,65660.000,00 American Tower 7.125%2012-10-15 650.100,00 1,70330.000,00 Amr Real Estate 7.125%2013-02-15 221.100,00 0,58460.000,00 Aramark 8.5% 2015-02-01 416.300,00 1,09585.000,00 Arch Western Finance 6.75%2013-07-01 507.487,50 1,33100.000,00 Avis Budget Car Rental 7.625%2014-05-15 29.000,00 0,08485.000,00 Ball 6.875% 2012-12-15 480.150,00 1,25130.000,00 Ball Corp 6,6250% 2018-03-15 116.350,00 0,30325.000,00 Basic Energy 7,125% 2016-04-15 185.250,00 0,48135.000,00 BE Aerospace 8,5% 2018-07-01 120.150,00 0,31410.000,00 Bristow Group 6.125%2013-06-15 295.200,00 0,77450.000,00 California Steel 6.125%2014-03-15 272.250,00 0,71260.000,00 Case 7.25% 2016-01-15 180.700,00 0,47350.000,00 Case New Holland 6%2009-06-01 339.500,00 0,89275.000,00 CCH I Holdings 9,92%2014-04-01 14.093,75 0,04605.000,00 Century Aluminum 7.5%2014-08-15 347.875,00 0,91125.000,00 Chemtura 6.875% 2016-06-01 64.375,00 0,17600.000,00 Chesapeake Energy 6.3750%2015-06-15 465.000,00 1,21455.000,00 Cie Gener de Geophysique 7.5%2015-05-15 277.550,00 0,72100.000,00 Cie Generale de Geophysique- 7.7500% 2017-05-15 57.500,00 0,15165.000,00 Compton Petroleum 7,6250%2013-12-01 49.500,00 0,13450.000,00 Constellation Brands 8,375%2014-12-15 427.500,00 1,12450.000,00 Constellation Brands8.125%2012-01-15 425.250,00 1,11405.000,00 Corrections Corp of America6.75% 2014-01-31 377.662,50 0,99425.000,00 Crown Americas 7.625%2013-11-15 420.750,00 1,10605.000,00 Delta Petroleum 7% 2015-04-01 121.000,00 0,32515.000,00 Denbury Recources 7.5%2015-12-15 365.650,00 0,95210.000,00 Directv 6,375% 2015-06-15 193.200,00 0,50300.000,00 Directv 8.375% 2013-03-15 298.500,00 0,78120.000,00 DR Horton 5,6250% 2016-01-15 73.200,00 0,1990.000,00 DR Horton 6,5000% 2016-04-15 55.800,00 0,15350.000,00 EchoStar DBS 6.375% 2011-10-01 325.500,00 0,85170.000,00 Echostar DBS Corp 6,625%2014-10-01 141.950,00 0,37535.000,00 Edison Mission En. 7,5%2013-06-15 489.525,00 1,28920.000,00 El Paso 6.875% 2014-06-15 745.200,00 1,9555.000,00 FMC Finance III 6,875%2017-07-15 51.425,00 0,13775.000,00 Ford Motor Company 7.450%2031-07-16 193.750,00 0,511.845.000,00 Ford Motor Credit 8% 2016-12-15 1.127.913,08 2,94635.000,00 Forest Oil 8% 2011-12-15 579.437,50 1,51450.000,00 Foundation Pa Coal 7.250%2014-08-01 366.750,00 0,96470.000,00 Freeport McMoRan 8.25%2015-04-01 390.100,00 1,021.400.000,00 General Motors 8.375%2033-07-15 227.500,00 0,59315.000,00 General Motors Accept 6,875%2012-08-28 217.209,51 0,57690.000,00 Georgia-Pacific 8.125%2011-05-15 652.050,00 1,70600.000,00 GMAC FRN 6,625% 2012-05-15 448.237,20 1,171.080.000,00 HCA 6,5% 2016-02-15 664.200,00 1,73345.000,00 Hertz Corp. 8,875% 2014-01-01 209.587,50 0,55370.000,00 Hexcel 6.75% 2015-02-01 281.200,00 0,73130.000,00 Hexion US Finance 9,75%2014-11-15 37.050,00 0,10420.000,00 Hornbeck Offshore 6.1250%2014-12-01 273.000,00 0,71425.000,00 Huntsman 11,5% 2012-07-15 340.000,00 0,89140.000,00 Idearc 8% 2016-11-15 11.200,00 0,03515.000,00 Inergy LP & Inergy 6.875%2014-12-15 401.700,00 1,05240.000,00 Innophos 8.875% 2014-08-15 168.000,00 0,44215.000,00 Interface 10.375% 2010-02-01 212.850,00 0,56630.000,00 Iron Mountain 7.75% 2015-01-15 565.425,00 1,48250.000,00 Itron Inc Reg 7.75% 2012-05-15 215.312,50 0,56150.000,00 K. Hovnanian Enterpr. 6.5%2014-01-15 38.250,00 0,10191.000,00 Koppers 9.875% 2013-10-15 175.720,00 0,46795.000,00 L-3 Communications 6.375%2015-10-15 735.375,00 1,92360.000,00 Lamar Media 6,625% 2015-08-15 259.200,00 0,68135.000,00 Lamar Media 7.25% 2013-01-01 107.325,00 0,28155.000,00 Mandalay Resort 9.375%2010-02-15 113.150,00 0,30200.000,00 Mandalay Resort Grp 6.375%2011-12-15 140.000,00 0,37335.000,00 Markwest Energy 8.5%2016-07-15 213.562,50 0,56425.000,00 Massey Energy 6.875%2013-12-15 317.687,50 0,83240.000,00 MetroPCS Wireless 9,25%2014-11-01 214.800,00 0,56215.000,00 MGM Mirage 6% 2009-10-01 206.400,00 0,54365.000,00 Mohegan Tribal Gam 6.125%2013-02-15 228.125,00 0,60260.000,00 Moog 6.25% 2015-01-15 208.000,00 0,54140.000,00 Morgan Stanley 6,75%2011-04-15 137.817,68 0,36325.000,00 Mueller Water Products 7,375%2017-06-01 221.000,00 0,58400.000,00 Nalco Company 7.75%2011-11-15 384.000,00 1,00200.000,00 Neiman Marcus 9% 2015-10-15 87.000,00 0,23160.000,00 Nortek Inc 8.5% 2014-09-01 36.800,00 0,10515.000,00 Novelis 7.25% 2015-02-15 298.700,00 0,78725.000,00 NRG Energy 7.25% 2014-02-01 681.500,00 1,78605.000,00 Owens-Brockway 6.75%2014-12-01 556.600,00 1,45170.000,00 Phi 7.125% 2013-04-15 103.700,00 0,2765.000,00 Phillips van Heusen 8.125%2013-05-01 52.975,00 0,14300.000,00 Pinnacle Entertainment 7,5%2015-06-15 175.500,00 0,46330.000,00 Range Resources 7.375%2013-07-15 287.925,00 0,75550.000,00 Rbs Global & Rexnord 9,50%2014-08-01 409.750,00 1,07410.000,00 Regency Energy Partners LP/R 8.37500% 2013-12-15 280.850,00 0,73590.000,00 Smithfield Foods 7% 2011-08-01 413.000,00 1,08Jebkāda starpība procentos no neto aktīviem ir noapaļošanas rezultāts.Pievienotās piezīmes ir šo finansu pārskatu neatņemama sastāvdaļa<strong>Nordea</strong> 1, <strong>SICAV</strong> ˙ Auditētais <strong>gada</strong> pārskats <strong>2008</strong> 123