- Page 1 and 2:
National Center for Environmental A
- Page 3 and 4:
CSEFH TABLE OF CONTENTS Child-Speci
- Page 5 and 6:
CSEFH 5 TABLE OF CONTENTS (Continue
- Page 7 and 8:
CSEFH TABLE OF CONTENTS (Continued)
- Page 9 and 10:
CSEFH TABLE OF CONTENTS (Continued)
- Page 11 and 12:
CSEFH 16 TABLE OF CONTENTS (Continu
- Page 13 and 14:
CSEFH LIST OF TABLES Child-Specific
- Page 15 and 16:
CSEFH LIST OF TABLES (Continued) Ch
- Page 17 and 18:
CSEFH LIST OF TABLES (Continued) Ch
- Page 19 and 20:
CSEFH LIST OF TABLES (Continued) Ch
- Page 21 and 22:
CSEFH LIST OF TABLES (Continued) Ch
- Page 23 and 24:
CSEFH LIST OF TABLES (Continued) Ch
- Page 25 and 26:
CSEFH LIST OF TABLES (Continued) Ch
- Page 27 and 28:
CSEFH LIST OF TABLES (Continued) Ch
- Page 29 and 30:
CSEFH ACRONYMS AND ABBREVIATIONS Ch
- Page 31 and 32:
CSEFH OPP = Office of Pesticide Pro
- Page 33 and 34:
CSEFH EXECUTIVE SUMMARY This Child-
- Page 35 and 36:
CSEFH were discussed in the guideli
- Page 37 and 38:
CSEFH Table ES-1. Summary of Recomm
- Page 39 and 40:
CSEFH Table ES-1. Summary of Recomm
- Page 41 and 42:
CSEFH Table ES-1. Summary of Recomm
- Page 43 and 44:
CSEFH Table ES-1. Summary of Recomm
- Page 45 and 46:
CSEFH Youngmoo Kim, U.S. EPA, Regio
- Page 47 and 48:
Child-Specific Exposure Factors Han
- Page 49 and 50:
Child-Specific Exposure Factors Han
- Page 51 and 52:
Child-Specific Exposure Factors Han
- Page 53 and 54:
Child-Specific Exposure Factors Han
- Page 55 and 56:
Child-Specific Exposure Factors Han
- Page 57 and 58:
Child-Specific Exposure Factors Han
- Page 59 and 60:
Child-Specific Exposure Factors Han
- Page 61 and 62:
Child-Specific Exposure Factors Han
- Page 63 and 64:
Child-Specific Exposure Factors Han
- Page 65 and 66:
Child-Specific Exposure Factors Han
- Page 67 and 68:
Child-Specific Exposure Factors Han
- Page 69 and 70:
Child-Specific Exposure Factors Han
- Page 71 and 72:
Child-Specific Exposure Factors Han
- Page 73 and 74:
exposure assessor) to distinguish b
- Page 75 and 76:
is perhaps the most common method o
- Page 77 and 78:
uncertainty is high, a sensitivity
- Page 79 and 80:
Peretz, C.; Goldberg, P.; Kahan, E.
- Page 81 and 82:
Table 2-3. Approaches to Quantitati
- Page 83 and 84:
water ingestion is summarized. Rele
- Page 85 and 86:
Child-Specific Exposure Factors Han
- Page 87 and 88:
3.3 DRINKING WATER INGESTION STUDIE
- Page 89 and 90:
that the three-day diary has been s
- Page 91 and 92:
million. In addition, whites were u
- Page 93 and 94:
an indicator of pool water ingestio
- Page 95 and 96:
Table 3-4. Per Capita a Estimates o
- Page 97 and 98:
Table 3-8. Per Capitaa Estimates of
- Page 99 and 100:
Table 3-11. Per Capita a Estimates
- Page 101 and 102:
Table 3-14. Consumers Onlya Estimat
- Page 103 and 104:
Table 3-18. Consumers Onlya Estimat
- Page 105 and 106:
Table 3-21. Consumers Only a Estima
- Page 107 and 108:
Water Ingested (mL/day) a from Wate
- Page 109 and 110:
Table 3-26. Plain Tap Water and Tot
- Page 111 and 112:
Total fluid Plain water Milk Carbon
- Page 113 and 114:
Tap Water Intake in Breastfed and F
- Page 115 and 116:
Table 3-32. Mean (± Standard Devia
- Page 117 and 118:
Study Group Table 3-34. Pool Water
- Page 119 and 120:
of specific mouthing events, expres
- Page 121 and 122:
Table 4-2. Confidence in Recommenda
- Page 123 and 124:
their children’s mouthing behavio
- Page 125 and 126:
to mouth activity was recorded duri
- Page 127 and 128:
contacts occurring during the objec
- Page 129 and 130:
unlikely to be representative of th
- Page 131 and 132:
2 to 3 days old, in a quiet, temper
- Page 133 and 134:
waking hours. Parents also recorded
- Page 135 and 136:
outdoor mouthing rates. The authors
- Page 137 and 138:
Activity Data of Two- to Four-Year-
- Page 139 and 140:
Table 4-6. Variability in Objects M
- Page 141 and 142:
Behavior Child-Specific Exposure Fa
- Page 143 and 144:
Child-Specific Exposure Factors Han
- Page 145 and 146:
Child-Specific Exposure Factors Han
- Page 147 and 148:
Table 4-17. Estimated Mean Daily Mo
- Page 149 and 150:
Child-Specific Exposure Factors Han
- Page 151 and 152:
Child-Specific Exposure Factors Han
- Page 153 and 154:
Child-Specific Exposure Factors Han
- Page 155 and 156:
Child-Specific Exposure Factors Han
- Page 157 and 158:
Child-Specific Exposure Factors Han
- Page 159 and 160:
Child-Specific Exposure Factors Han
- Page 161 and 162:
Child-Specific Exposure Factors Han
- Page 163 and 164:
Child-Specific Exposure Factors Han
- Page 165 and 166:
Child-Specific Exposure Factors Han
- Page 167 and 168:
Child-Specific Exposure Factors Han
- Page 169 and 170:
Child-Specific Exposure Factors Han
- Page 171 and 172:
Child-Specific Exposure Factors Han
- Page 173 and 174:
Child-Specific Exposure Factors Han
- Page 175 and 176:
Child-Specific Exposure Factors Han
- Page 177 and 178:
Child-Specific Exposure Factors Han
- Page 179 and 180:
Child-Specific Exposure Factors Han
- Page 181 and 182:
Child-Specific Exposure Factors Han
- Page 183 and 184:
Child-Specific Exposure Factors Han
- Page 185 and 186:
Child-Specific Exposure Factors Han
- Page 187 and 188:
Child-Specific Exposure Factors Han
- Page 189 and 190:
Child-Specific Exposure Factors Han
- Page 191 and 192:
Child-Specific Exposure Factors Han
- Page 193 and 194:
Child-Specific Exposure Factors Han
- Page 195 and 196:
Child-Specific Exposure Factors Han
- Page 197 and 198:
Child-Specific Exposure Factors Han
- Page 199 and 200:
Child-Specific Exposure Factors Han
- Page 201 and 202:
Child-Specific Exposure Factors Han
- Page 203 and 204:
Child-Specific Exposure Factors Han
- Page 205 and 206:
Child-Specific Exposure Factors Han
- Page 207 and 208:
Child-Specific Exposure Factors Han
- Page 209 and 210:
Child-Specific Exposure Factors Han
- Page 211 and 212:
Child-Specific Exposure Factors Han
- Page 213 and 214:
Child-Specific Exposure Factors Han
- Page 215 and 216:
Child-Specific Exposure Factors Han
- Page 217 and 218:
Child-Specific Exposure Factors Han
- Page 219 and 220:
Child-Specific Exposure Factors Han
- Page 221 and 222:
Child-Specific Exposure Factors Han
- Page 223 and 224:
Child-Specific Exposure Factors Han
- Page 225 and 226:
Child-Specific Exposure Factors Han
- Page 227 and 228:
Child-Specific Exposure Factors Han
- Page 229 and 230:
Child-Specific Exposure Factors Han
- Page 231 and 232:
Child-Specific Exposure Factors Han
- Page 233 and 234:
Child-Specific Exposure Factors Han
- Page 235 and 236:
Child-Specific Exposure Factors Han
- Page 237 and 238:
Child-Specific Exposure Factors Han
- Page 239 and 240:
Child-Specific Exposure Factors Han
- Page 241 and 242:
Child-Specific Exposure Factors Han
- Page 243 and 244:
Child-Specific Exposure Factors Han
- Page 245 and 246:
Child-Specific Exposure Factors Han
- Page 247 and 248:
Child-Specific Exposure Factors Han
- Page 249 and 250:
Child-Specific Exposure Factors Han
- Page 251 and 252:
Child-Specific Exposure Factors Han
- Page 253 and 254:
Child-Specific Exposure Factors Han
- Page 255 and 256:
Child-Specific Exposure Factors Han
- Page 257 and 258:
Child-Specific Exposure Factors Han
- Page 259 and 260:
Child-Specific Exposure Factors Han
- Page 261 and 262:
Child-Specific Exposure Factors Han
- Page 263 and 264:
Child-Specific Exposure Factors Han
- Page 265 and 266:
Child-Specific Exposure Factors Han
- Page 267 and 268:
Child-Specific Exposure Factors Han
- Page 269 and 270:
Child-Specific Exposure Factors Han
- Page 271 and 272:
Child-Specific Exposure Factors Han
- Page 273 and 274:
Child-Specific Exposure Factors Han
- Page 275 and 276:
Child-Specific Exposure Factors Han
- Page 277 and 278:
Age Group Birth to
- Page 279 and 280:
8.3 KEY BODY WEIGHT STUDY 8.3.1 U.S
- Page 281 and 282:
III (1966-70) for ages 12-17 years,
- Page 283 and 284:
8.4.9 Kahn and Stralka, 2008 - Esti
- Page 285 and 286:
Table 8-3. Mean and Percentile Body
- Page 287 and 288:
Page Child-Specific Exposure Factor
- Page 289 and 290:
Table 8-8. Statistics for Probabili
- Page 291 and 292:
Child-Specific Exposure Factors Han
- Page 293 and 294:
Child-Specific Exposure Factors Han
- Page 295 and 296:
Figure 8-2. Weight by Age Percentil
- Page 297 and 298:
Figure 8-4. Weight by Length Percen
- Page 299 and 300:
Figure 8-6. Body Mass Index-for-Age
- Page 301 and 302:
Child-Specific Exposure Factors Han
- Page 303 and 304:
Page Child-Specific Exposure Factor
- Page 305 and 306:
Page Child-Specific Exposure Factor
- Page 307 and 308:
Age Group a Child-Specific Exposure
- Page 309 and 310:
Age Group a Child-Specific Exposure
- Page 311 and 312:
Page Child-Specific Exposure Factor
- Page 313 and 314:
Source: Gestational Age (weeks) 25
- Page 315 and 316:
of the food consumed after the mois
- Page 317 and 318:
Minimal (or Defined) Bias Child-Spe
- Page 319 and 320:
9.3 INTAKE STUDIES The primary sour
- Page 321 and 322:
9.3.2 Relevant Fruit and Vegetable
- Page 323 and 324:
Weighted data were used in all of t
- Page 325 and 326:
Page Child-Specific Exposure Factor
- Page 327 and 328: Page Child-Specific Exposure Factor
- Page 329 and 330: Page Child-Specific Exposure Factor
- Page 331 and 332: Page Child-Specific Exposure Factor
- Page 333 and 334: Page Child-Specific Exposure Factor
- Page 335 and 336: Page Child-Specifi c Exposur e Fact
- Page 337 and 338: Page Child-Specific Exposure Factor
- Page 339 and 340: Child-Specific Exposure Factors Han
- Page 341 and 342: Child-Specific Exposure Factors Han
- Page 343 and 344: Child-Specific Exposure Factors Han
- Page 345 and 346: Vegetables Any Vegetable Baby Food
- Page 347 and 348: 4 to 5 months 6 to 11 months 12 to
- Page 349 and 350: All fruits Canned fruit Fresh fruit
- Page 351 and 352: Table 9-23. Mean Moisture Content o
- Page 353 and 354: Child-Specific Exposure Factors Han
- Page 355 and 356: Child-Specific Exposure Factors Han
- Page 357 and 358: Child-Specific Exposure Factors Han
- Page 359 and 360: Child-Specific Exposure Factors Han
- Page 361 and 362: Child-Specific Exposure Factors Han
- Page 363 and 364: eported on fish intake for children
- Page 365 and 366: a Table 10-1. Recommended Values fo
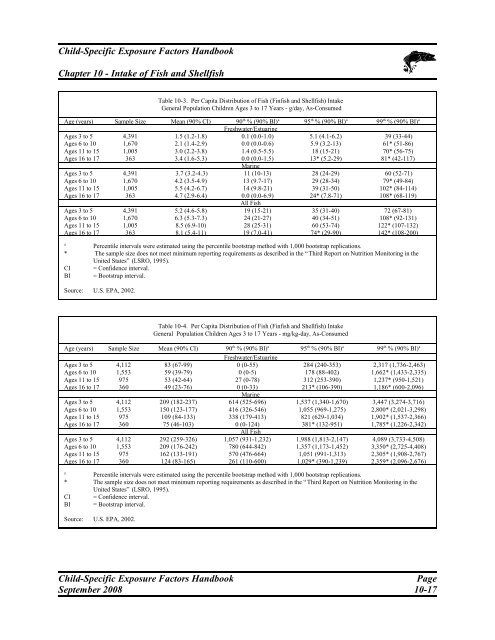
- Page 367 and 368: 10.3 GENERAL POPULATION STUDIES 10.
- Page 369 and 370: Minnesota, and North Dakota. While
- Page 371 and 372: elow the value of 8 ounces most com
- Page 373 and 374: into a single pooled data set is so
- Page 375 and 376: as described in Section 10.6.1.2, a
- Page 377: Columbia River Inter-Tribal Fish Co
- Page 381 and 382: Child-Specific Exposure Factors Han
- Page 383 and 384: Table 10-12. Fish Consumption Among
- Page 385 and 386: Child-Specific Exposure Factors Han
- Page 387 and 388: Table 10-18. Mean Fish Intake Among
- Page 389 and 390: Child-Specific Exposure Factors Han
- Page 391 and 392: Table 10-23. Consumption Rates for
- Page 393 and 394: Species a Anadromous fish Pelagic f
- Page 395 and 396: Child-Specific Exposure Factors Han
- Page 397 and 398: Lingcod Mackerel, Atlantic Mackerel
- Page 399 and 400: Child-Specific Exposure Factors Han
- Page 401 and 402: Child-Specific Exposure Factors Han
- Page 403 and 404: Child-Specific Exposure Factors Han
- Page 405 and 406: Child-Specific Exposure Factors Han
- Page 407 and 408: Child-Specific Exposure Factors Han
- Page 409 and 410: Child-Specific Exposure Factors Han
- Page 411 and 412: Child-Specific Exposure Factors Han
- Page 413 and 414: Child-Specific Exposure Factors Han
- Page 415 and 416: Child-Specific Exposure Factors Han
- Page 417 and 418: Child-Specific Exposure Factors Han
- Page 419 and 420: Child-Specific Exposure Factors Han
- Page 421 and 422: Child-Specific Exposur e Factor s H
- Page 423 and 424: Child-Specific Exposure Factors Han
- Page 425 and 426: Child-Specific Exposure Factors Han
- Page 427 and 428: Child-Specific Exposure Factors Han
- Page 429 and 430:
Child-Specific Exposure Factors Han
- Page 431 and 432:
Child-Specific Exposure Factors Han
- Page 433 and 434:
Child-Specific Exposure Factors Han
- Page 435 and 436:
Child-Specific Exposure Factors Han
- Page 437 and 438:
Child-Specific Exposure Factors Han
- Page 439 and 440:
Child-Specific Exposure Factors Han
- Page 441 and 442:
Child-Specific Exposure Factors Han
- Page 443 and 444:
Child-Specific Exposure Factors Han
- Page 445 and 446:
Child-Specific Exposure Factors Han
- Page 447 and 448:
Child-Specific Exposure Factors Han
- Page 449 and 450:
Child-Specific Exposure Factors Han
- Page 451 and 452:
Child-Specific Exposure Factors Han
- Page 453 and 454:
Child-Specific Exposure Factors Han
- Page 455 and 456:
Child-Specific Exposure Factors Han
- Page 457 and 458:
Child-Specific Exposure Factors Han
- Page 459 and 460:
Child-Specific Exposure Factors Han
- Page 461 and 462:
Child-Specific Exposure Factors Han
- Page 463 and 464:
Child-Specific Exposure Factors Han
- Page 465 and 466:
Child-Specific Exposure Factors Han
- Page 467 and 468:
Child-Specific Exposure Factors Han
- Page 469 and 470:
Child-Specific Exposure Factors Han
- Page 471 and 472:
Total Grains 95000060 15000250 1500
- Page 473 and 474:
Child-Specific Exposure Factors Han
- Page 475 and 476:
Child-Specific Exposure Factors Han
- Page 477 and 478:
Child-Specific Exposure Factors Han
- Page 479 and 480:
Child-Specific Exposure Factors Han
- Page 481 and 482:
Child-Specific Exposure Factors Han
- Page 483 and 484:
Child-Specific Exposure Factors Han
- Page 485 and 486:
Child-Specific Exposure Factors Han
- Page 487 and 488:
Child-Specific Exposure Factors Han
- Page 489 and 490:
Child-Specific Exposure Factors Han
- Page 491 and 492:
Child-Specific Exposure Factors Han
- Page 493 and 494:
Child-Specific Exposure Factors Han
- Page 495 and 496:
Child-Specific Exposure Factors Han
- Page 497 and 498:
Child-Specific Exposure Factors Han
- Page 499 and 500:
Child-Specific Exposure Factors Han
- Page 501 and 502:
Child-Specific Exposure Factors Han
- Page 503 and 504:
Child-Specific Exposure Factors Han
- Page 505 and 506:
Child-Specific Exposure Factors Han
- Page 507 and 508:
Child-Specific Exposure Factors Han
- Page 509 and 510:
Child-Specific Exposure Factors Han
- Page 511 and 512:
Child-Specific Exposure Factors Han
- Page 513 and 514:
Child-Specific Exposure Factors Han
- Page 515 and 516:
Child-Specific Exposure Factors Han
- Page 517 and 518:
Child-Specific Exposure Factors Han
- Page 519 and 520:
Child-Specific Exposure Factors Han
- Page 521 and 522:
Child-Specific Exposure Factors Han
- Page 523 and 524:
Child-Specific Exposure Factors Han
- Page 525 and 526:
Child-Specific Exposure Factors Han
- Page 527 and 528:
Child-Specific Exposure Factors Han
- Page 529 and 530:
Child-Specific Exposure Factors Han
- Page 531 and 532:
Child-Specific Exposure Factors Han
- Page 533 and 534:
Child-Specific Exposure Factors Han
- Page 535 and 536:
Child-Specific Exposure Factors Han
- Page 537 and 538:
Child-Specific Exposure Factors Han
- Page 539 and 540:
Child-Specific Exposure Factors Han
- Page 541 and 542:
Child-Specific Exposure Factors Han
- Page 543 and 544:
Child-Specific Exposure Factors Han
- Page 545 and 546:
Child-Specific Exposure Factors Han
- Page 547 and 548:
Child-Specific Exposure Factors Han
- Page 549 and 550:
Child-Specific Exposure Factors Han
- Page 551 and 552:
Child-Specific Exposure Factors Han
- Page 553 and 554:
Child-Specific Exposure Factors Han
- Page 555 and 556:
Child-Specific Exposure Factors Han
- Page 557 and 558:
Child-Specific Exposure Factors Han
- Page 559 and 560:
Child-Specific Exposure Factors Han
- Page 561 and 562:
Child-Specific Exposure Factors Han
- Page 563 and 564:
Child-Specific Exposure Factors Han
- Page 565 and 566:
Child-Specific Exposure Factors Han
- Page 567 and 568:
Child-Specific Exposure Factors Han
- Page 569 and 570:
Child-Specific Exposure Factors Han
- Page 571 and 572:
Child-Specific Exposure Factors Han
- Page 573 and 574:
Child-Specific Exposure Factors Han
- Page 575 and 576:
Child-Specific Exposure Factors Han
- Page 577 and 578:
Child-Specific Exposure Factors Han
- Page 579 and 580:
Child-Specific Exposure Factors Han
- Page 581 and 582:
Child-Specific Exposure Factors Han
- Page 583 and 584:
Child-Specific Exposure Factors Han
- Page 585 and 586:
Child-Specific Exposure Factors Han
- Page 587 and 588:
Child-Specific Exposure Factors Han
- Page 589 and 590:
Child-Specific Exposure Factors Han
- Page 591 and 592:
Child-Specific Exposure Factors Han
- Page 593 and 594:
Child-Specific Exposure Factors Han
- Page 595 and 596:
Child-Specific Exposure Factors Han
- Page 597 and 598:
Child-Specific Exposure Factors Han
- Page 599 and 600:
Child-Specific Exposure Factors Han
- Page 601 and 602:
Child-Specific Exposure Factors Han
- Page 603 and 604:
Child-Specific Exposure Factors Han
- Page 605 and 606:
Child-Specific Exposure Factors Han
- Page 607 and 608:
Child-Specific Exposure Factors Han
- Page 609 and 610:
Child-Specific Exposure Factors Han
- Page 611 and 612:
Child-Specific Exposure Factors Han
- Page 613 and 614:
Child-Specific Exposure Factors Han
- Page 615 and 616:
Child-Specific Exposure Factors Han
- Page 617 and 618:
Child-Specific Exposure Factors Han
- Page 619 and 620:
Child-Specific Exposure Factors Han
- Page 621 and 622:
Child-Specific Exposure Factors Han
- Page 623 and 624:
Child-Specific Exposure Factors Han
- Page 625 and 626:
Child-Specific Exposure Factors Han
- Page 627 and 628:
Child-Specific Exposure Factors Han
- Page 629 and 630:
Child-Specific Exposure Factors Han
- Page 631 and 632:
Child-Specific Exposure Factors Han
- Page 633 and 634:
Child-Specific Exposure Factors Han
- Page 635 and 636:
Child-Specific Exposure Factors Han
- Page 637 and 638:
Child-Specific Exposure Factors Han
- Page 639 and 640:
Child-Specific Exposure Factors Han
- Page 641 and 642:
Child-Specific Exposure Factors Han
- Page 643 and 644:
Child-Specific Exposure Factors Han
- Page 645 and 646:
Child-Specific Exposure Factors Han
- Page 647 and 648:
Child-Specific Exposure Factors Han
- Page 649 and 650:
Child-Specific Exposure Factors Han
- Page 651 and 652:
Child-Specific Exposure Factors Han
- Page 653 and 654:
Child-Specific Exposure Factors Han
- Page 655 and 656:
Child-Specific Exposure Factors Han
- Page 657 and 658:
Child-Specific Exposure Factors Han
- Page 659 and 660:
Child-Specific Exposure Factors Han
- Page 661 and 662:
Child-Specific Exposure Factors Han
- Page 663 and 664:
Child-Specific Exposure Factors Han
- Page 665 and 666:
Child-Specific Exposure Factors Han
- Page 667 and 668:
Child-Specific Exposure Factors Han
- Page 669 and 670:
Child-Specific Exposure Factors Han
- Page 671 and 672:
Child-Specific Exposure Factors Han
- Page 673 and 674:
Child-Specific Exposure Factors Han
- Page 675 and 676:
Child-Specific Exposure Factors Han
- Page 677 and 678:
Child-Specific Exposure Factors Han
- Page 679:
National Center for Environmental A