- Page 1:
UC STRATEGIC ENERGY PLAN University
- Page 4 and 5:
TABLE OF CONTENTS (CONTINUED) 12. E
- Page 7 and 8:
1. EXECUTIVE SUMMARY 1.1 Policy on
- Page 9 and 10:
Table 1.1: Summary of Baseline and
- Page 11:
The campus has reviewed a prelimina
- Page 14 and 15:
Construction costs of recommended p
- Page 16 and 17:
Campus Los Angeles Santa Monica Hos
- Page 18 and 19:
2.3 Campus Overview University of C
- Page 20 and 21:
Table 2.4: SEP Buildings (Continued
- Page 23:
3. HISTORICAL CAMPUS ENERGY USE 3.1
- Page 26 and 27:
4.2 Individual Building Metering Bu
- Page 28 and 29:
of UCSD buildings is shown in Figur
- Page 31:
5. UTILITIES 5.1 Providers & Tariff
- Page 35 and 36:
7. RENEWABLE ENERGY GENERATION 7.1
- Page 37 and 38:
8. RECOMMENDED ENERGY EFFICIENCY PR
- Page 39 and 40:
One campus, UC Santa Barbara, has c
- Page 41 and 42:
The controllers themselves are prog
- Page 43 and 44:
8.2.3 Air Handler Project 3. Demand
- Page 45 and 46:
standard control sequence. Temperat
- Page 47 and 48:
8.2.11 Laboratory Air Handler Proje
- Page 49 and 50:
The projected MBCx energy savings f
- Page 51 and 52:
The budget that each campus has to
- Page 53 and 54:
8.7 Other Projects 8.7.1 Swimming P
- Page 55 and 56:
8.8.3 UCLA Custom Project 3. TOD Co
- Page 57:
9. BUILDING OVERVIEW & PROJECTS The
- Page 60 and 61:
Strategic Energy Plan Projects SEP
- Page 62 and 63:
Strategic Energy Plan Projects SEP
- Page 64 and 65:
Strategic Energy Plan Projects SEP
- Page 66 and 67:
2006-2008 Partnership Projects Stra
- Page 68 and 69:
Strategic Energy Plan Projects SEP
- Page 70 and 71:
Strategic Energy Plan Projects SEP
- Page 72 and 73:
Strategic Energy Plan Projects SEP
- Page 74 and 75:
Strategic Energy Plan Projects SEP
- Page 76 and 77:
Strategic Energy Plan Projects SEP
- Page 78 and 79:
Strategic Energy Plan Projects SEP
- Page 80 and 81:
Strategic Energy Plan Projects SEP
- Page 82 and 83:
Strategic Energy Plan Projects SEP
- Page 84 and 85:
Strategic Energy Plan Projects SEP
- Page 86 and 87:
Strategic Energy Plan Projects SEP
- Page 88 and 89:
Strategic Energy Plan Projects SEP
- Page 90 and 91:
Strategic Energy Plan Projects SEP
- Page 92 and 93:
Strategic Energy Plan Projects SEP
- Page 94 and 95:
Strategic Energy Plan Projects SEP
- Page 96 and 97:
Strategic Energy Plan Projects SEP
- Page 98 and 99:
Strategic Energy Plan Projects SEP
- Page 100 and 101:
Strategic Energy Plan Projects SEP
- Page 102 and 103:
Strategic Energy Plan Projects SEP
- Page 104 and 105:
Strategic Energy Plan Projects SEP
- Page 106 and 107:
Strategic Energy Plan Projects SEP
- Page 108 and 109:
Strategic Energy Plan Projects SEP
- Page 110 and 111:
Strategic Energy Plan Projects SEP
- Page 112 and 113:
Strategic Energy Plan Projects SEP
- Page 114 and 115:
Strategic Energy Plan Projects SEP
- Page 116 and 117:
Strategic Energy Plan Projects SEP
- Page 118 and 119:
Strategic Energy Plan Projects SEP
- Page 120 and 121:
Strategic Energy Plan Projects SEP
- Page 122 and 123:
Strategic Energy Plan Projects SEP
- Page 124 and 125:
Strategic Energy Plan Projects SEP
- Page 126 and 127:
Strategic Energy Plan Projects SEP
- Page 128 and 129:
Strategic Energy Plan Projects SEP
- Page 130 and 131:
Strategic Energy Plan Projects SEP
- Page 132 and 133:
Strategic Energy Plan Projects SEP
- Page 135 and 136:
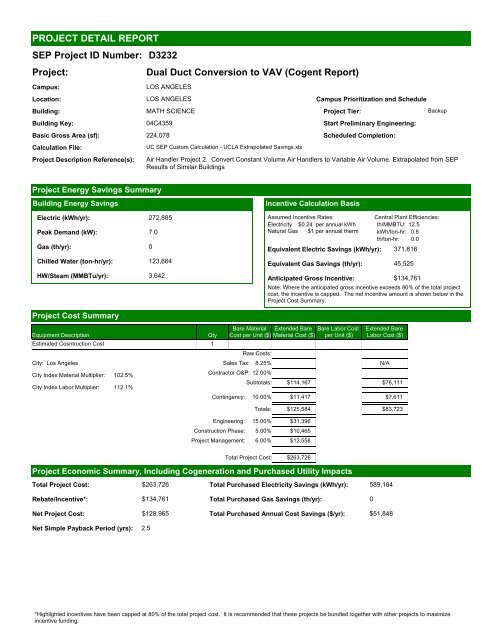
PROJECT DETAIL REPORT SEP Project I
- Page 137 and 138:
PROJECT DETAIL REPORT SEP Project I
- Page 139:
PROJECT DETAIL REPORT SEP Project I
- Page 142 and 143:
City: Los Angeles City Index Materi
- Page 144 and 145:
PROJECT DETAIL REPORT SEP Project I
- Page 147 and 148:
PROJECT DETAIL REPORT SEP Project I
- Page 149 and 150:
PROJECT DETAIL REPORT SEP Project I
- Page 151 and 152:
PROJECT DETAIL REPORT SEP Project I
- Page 153 and 154:
City: Los Angeles City Index Materi
- Page 155 and 156:
PROJECT DETAIL REPORT SEP Project I
- Page 157 and 158:
PROJECT DETAIL REPORT SEP Project I
- Page 159 and 160:
PROJECT DETAIL REPORT SEP Project I
- Page 161 and 162:
PROJECT DETAIL REPORT SEP Project I
- Page 163 and 164:
PROJECT DETAIL REPORT SEP Project I
- Page 165 and 166:
PROJECT DETAIL REPORT SEP Project I
- Page 167 and 168:
PROJECT DETAIL REPORT SEP Project I
- Page 169 and 170:
PROJECT DETAIL REPORT SEP Project I
- Page 171 and 172:
PROJECT DETAIL REPORT SEP Project I
- Page 173 and 174:
PROJECT DETAIL REPORT SEP Project I
- Page 175 and 176:
PROJECT DETAIL REPORT SEP Project I
- Page 177 and 178:
PROJECT DETAIL REPORT SEP Project I
- Page 179 and 180:
PROJECT DETAIL REPORT SEP Project I
- Page 181 and 182:
PROJECT DETAIL REPORT SEP Project I
- Page 183 and 184:
PROJECT DETAIL REPORT SEP Project I
- Page 185 and 186:
PROJECT DETAIL REPORT SEP Project I
- Page 187 and 188:
PROJECT DETAIL REPORT SEP Project I
- Page 189 and 190:
PROJECT DETAIL REPORT SEP Project I
- Page 191 and 192:
PROJECT DETAIL REPORT SEP Project I
- Page 193 and 194:
PROJECT DETAIL REPORT SEP Project I
- Page 195 and 196:
PROJECT DETAIL REPORT SEP Project I
- Page 197 and 198:
PROJECT DETAIL REPORT SEP Project I
- Page 199 and 200:
PROJECT DETAIL REPORT SEP Project I
- Page 201 and 202:
PROJECT DETAIL REPORT SEP Project I
- Page 203:
PROJECT DETAIL REPORT SEP Project I
- Page 206 and 207:
City: Los Angeles City Index Materi
- Page 208 and 209:
PROJECT DETAIL REPORT SEP Project I
- Page 210 and 211:
PROJECT DETAIL REPORT SEP Project I
- Page 212 and 213:
PROJECT DETAIL REPORT SEP Project I
- Page 214 and 215:
PROJECT DETAIL REPORT SEP Project I
- Page 216 and 217:
PROJECT DETAIL REPORT SEP Project I
- Page 218 and 219:
PROJECT DETAIL REPORT SEP Project I
- Page 220 and 221:
PROJECT DETAIL REPORT SEP Project I
- Page 222 and 223:
PROJECT DETAIL REPORT SEP Project I
- Page 224 and 225:
PROJECT DETAIL REPORT SEP Project I
- Page 226 and 227:
PROJECT DETAIL REPORT SEP Project I
- Page 228 and 229:
PROJECT DETAIL REPORT SEP Project I
- Page 230 and 231:
PROJECT DETAIL REPORT SEP Project I
- Page 232 and 233:
PROJECT DETAIL REPORT SEP Project I
- Page 234 and 235:
PROJECT DETAIL REPORT SEP Project I
- Page 236 and 237:
PROJECT DETAIL REPORT SEP Project I
- Page 238 and 239:
PROJECT DETAIL REPORT SEP Project I
- Page 240 and 241:
PROJECT DETAIL REPORT SEP Project I
- Page 242 and 243:
PROJECT DETAIL REPORT SEP Project I
- Page 244 and 245:
PROJECT DETAIL REPORT SEP Project I
- Page 246 and 247:
PROJECT DETAIL REPORT SEP Project I
- Page 248 and 249:
PROJECT DETAIL REPORT SEP Project I
- Page 250 and 251:
PROJECT DETAIL REPORT SEP Project I
- Page 252 and 253:
PROJECT DETAIL REPORT SEP Project I
- Page 254 and 255:
PROJECT DETAIL REPORT SEP Project I
- Page 256 and 257:
PROJECT DETAIL REPORT SEP Project I
- Page 258 and 259:
PROJECT DETAIL REPORT SEP Project I
- Page 260 and 261:
PROJECT DETAIL REPORT SEP Project I
- Page 262 and 263:
PROJECT DETAIL REPORT SEP Project I
- Page 264 and 265:
PROJECT DETAIL REPORT SEP Project I
- Page 266 and 267:
PROJECT DETAIL REPORT SEP Project I
- Page 268 and 269:
PROJECT DETAIL REPORT SEP Project I
- Page 270 and 271:
PROJECT DETAIL REPORT SEP Project I
- Page 272 and 273:
PROJECT DETAIL REPORT SEP Project I
- Page 274 and 275:
PROJECT DETAIL REPORT SEP Project I
- Page 276 and 277:
PROJECT DETAIL REPORT SEP Project I
- Page 278 and 279:
PROJECT DETAIL REPORT SEP Project I
- Page 280 and 281:
PROJECT DETAIL REPORT SEP Project I
- Page 282 and 283:
PROJECT DETAIL REPORT SEP Project I
- Page 284 and 285:
PROJECT DETAIL REPORT SEP Project I
- Page 286 and 287:
PROJECT DETAIL REPORT SEP Project I
- Page 288 and 289:
PROJECT DETAIL REPORT SEP Project I
- Page 290 and 291:
PROJECT DETAIL REPORT SEP Project I
- Page 292 and 293:
PROJECT DETAIL REPORT SEP Project I
- Page 294 and 295:
PROJECT DETAIL REPORT SEP Project I
- Page 296 and 297:
PROJECT DETAIL REPORT SEP Project I
- Page 298 and 299:
PROJECT DETAIL REPORT SEP Project I
- Page 300 and 301:
PROJECT DETAIL REPORT SEP Project I
- Page 302 and 303:
PROJECT DETAIL REPORT SEP Project I
- Page 304 and 305:
PROJECT DETAIL REPORT SEP Project I
- Page 306 and 307:
PROJECT DETAIL REPORT SEP Project I
- Page 308 and 309:
PROJECT DETAIL REPORT SEP Project I
- Page 310 and 311:
PROJECT DETAIL REPORT SEP Project I
- Page 312 and 313:
PROJECT DETAIL REPORT SEP Project I
- Page 314 and 315:
PROJECT DETAIL REPORT SEP Project I
- Page 316 and 317:
PROJECT DETAIL REPORT SEP Project I
- Page 318 and 319:
PROJECT DETAIL REPORT SEP Project I
- Page 320 and 321:
PROJECT DETAIL REPORT SEP Project I
- Page 322 and 323:
PROJECT DETAIL REPORT SEP Project I
- Page 324 and 325:
PROJECT DETAIL REPORT SEP Project I
- Page 326 and 327:
PROJECT DETAIL REPORT SEP Project I
- Page 328 and 329:
PROJECT DETAIL REPORT SEP Project I
- Page 330 and 331:
PROJECT DETAIL REPORT SEP Project I
- Page 332 and 333:
PROJECT DETAIL REPORT SEP Project I
- Page 334 and 335:
PROJECT DETAIL REPORT SEP Project I
- Page 336 and 337: PROJECT DETAIL REPORT SEP Project I
- Page 338 and 339: PROJECT DETAIL REPORT SEP Project I
- Page 340 and 341: PROJECT DETAIL REPORT SEP Project I
- Page 342 and 343: PROJECT DETAIL REPORT SEP Project I
- Page 344 and 345: PROJECT DETAIL REPORT SEP Project I
- Page 346 and 347: PROJECT DETAIL REPORT SEP Project I
- Page 348 and 349: PROJECT DETAIL REPORT SEP Project I
- Page 350 and 351: PROJECT DETAIL REPORT SEP Project I
- Page 352 and 353: PROJECT DETAIL REPORT SEP Project I
- Page 354 and 355: PROJECT DETAIL REPORT SEP Project I
- Page 356 and 357: PROJECT DETAIL REPORT SEP Project I
- Page 358 and 359: PROJECT DETAIL REPORT SEP Project I
- Page 360 and 361: PROJECT DETAIL REPORT SEP Project I
- Page 362 and 363: PROJECT DETAIL REPORT SEP Project I
- Page 364 and 365: PROJECT DETAIL REPORT SEP Project I
- Page 366 and 367: PROJECT DETAIL REPORT SEP Project I
- Page 368 and 369: PROJECT DETAIL REPORT SEP Project I
- Page 370 and 371: PROJECT DETAIL REPORT SEP Project I
- Page 372 and 373: PROJECT DETAIL REPORT SEP Project I
- Page 374 and 375: PROJECT DETAIL REPORT SEP Project I
- Page 376 and 377: PROJECT DETAIL REPORT SEP Project I
- Page 378 and 379: PROJECT DETAIL REPORT SEP Project I
- Page 380 and 381: PROJECT DETAIL REPORT SEP Project I
- Page 382 and 383: PROJECT DETAIL REPORT SEP Project I
- Page 384 and 385: PROJECT DETAIL REPORT SEP Project I
- Page 388 and 389: PROJECT DETAIL REPORT SEP Project I
- Page 390 and 391: PROJECT DETAIL REPORT SEP Project I
- Page 392 and 393: PROJECT DETAIL REPORT SEP Project I
- Page 394 and 395: PROJECT DETAIL REPORT SEP Project I
- Page 396 and 397: PROJECT DETAIL REPORT SEP Project I
- Page 398 and 399: PROJECT DETAIL REPORT SEP Project I
- Page 400 and 401: PROJECT DETAIL REPORT SEP Project I
- Page 402 and 403: PROJECT DETAIL REPORT SEP Project I
- Page 404 and 405: PROJECT DETAIL REPORT SEP Project I
- Page 406 and 407: PROJECT DETAIL REPORT SEP Project I
- Page 408 and 409: PROJECT DETAIL REPORT SEP Project I
- Page 410 and 411: PROJECT DETAIL REPORT SEP Project I
- Page 413 and 414: 11. PROJECT LISTS & SUMMARY OF PROJ
- Page 415 and 416: Table 11.1: SEP Projects by Funding
- Page 417 and 418: Table 11.1: SEP Projects by Funding
- Page 419 and 420: Table 11.1: SEP Projects by Funding
- Page 421: Table 11.1: SEP Projects by Funding
- Page 424 and 425: educing growth adjusted electricity
- Page 426 and 427: step within the Strategic Energy Pl
- Page 429: Appendix A Field Data Forms (Electr
- Page 433: Appendix C Other Calculations and D