Dictionary of Evidence-based Medicine.pdf
Dictionary of Evidence-based Medicine.pdf
Dictionary of Evidence-based Medicine.pdf

Create successful ePaper yourself
Turn your PDF publications into a flip-book with our unique Google optimized e-Paper software.
66 <strong>Dictionary</strong> <strong>of</strong> <strong>Evidence</strong>-<strong>based</strong> <strong>Medicine</strong><br />
for given geographical areas to care for patient groups <strong>of</strong> about 100 000 in<br />
size (DoH (1997) The new NHS. Cmd 3807. HMSO, London).<br />
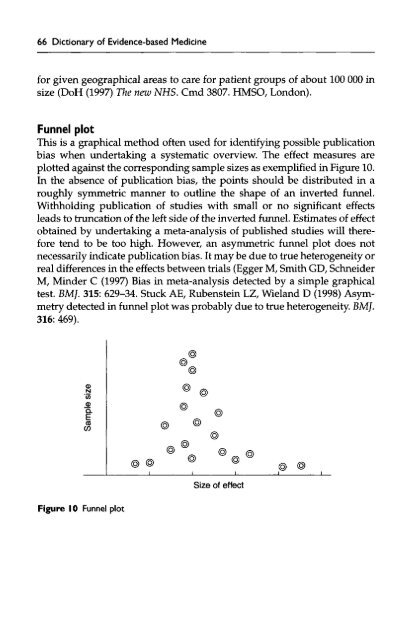
Funnel plot<br />
This is a graphical method <strong>of</strong>ten used for identifying possible publication<br />
bias when undertaking a systematic overview. The effect measures are<br />
plotted against the corresponding sample sizes as exemplified in Figure 10.<br />
In the absence <strong>of</strong> publication bias, the points should be distributed in a<br />
roughly symmetric manner to outline the shape <strong>of</strong> an inverted funnel.<br />
Withholding publication <strong>of</strong> studies with small or no significant effects<br />
leads to truncation <strong>of</strong> the left side <strong>of</strong> the inverted funnel. Estimates <strong>of</strong> effect<br />
obtained by undertaking a meta-analysis <strong>of</strong> published studies will therefore<br />
tend to be too high. However, an asymmetric funnel plot does not<br />
necessarily indicate publication bias. It may be due to true heterogeneity or<br />
real differences in the effects between trials (Egger M, Smith GD, Schneider<br />
M, Minder C (1997) Bias in meta-analysis detected by a simple graphical<br />
test. BMJ. 315: 629-34. Stuck AE, Rubenstein LZ, Wieland D (1998) Asymmetry<br />
detected in funnel plot was probably due to true heterogeneity. BMJ.<br />
316: 469).<br />
Figure 10 Funnel plot