Dictionary of Evidence-based Medicine.pdf
Dictionary of Evidence-based Medicine.pdf
Dictionary of Evidence-based Medicine.pdf
You also want an ePaper? Increase the reach of your titles
YUMPU automatically turns print PDFs into web optimized ePapers that Google loves.
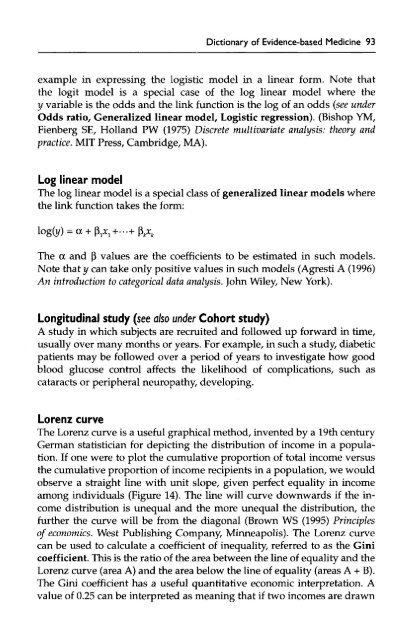
<strong>Dictionary</strong> <strong>of</strong> <strong>Evidence</strong>-<strong>based</strong> <strong>Medicine</strong> 93<br />
example in expressing the logistic model in a linear form. Note that<br />
the logit model is a special case <strong>of</strong> the log linear model where the<br />
y variable is the odds and the link function is the log <strong>of</strong> an odds (see under<br />
Odds ratio, Generalized linear model, Logistic regression). (Bishop YM,<br />
Fienberg SE, Holland PW (1975) Discrete multivariate analysis: theory and<br />
practice. MIT Press, Cambridge, MA).<br />
Log linear model<br />
The log linear model is a special class <strong>of</strong> generalized linear models where<br />
the link function takes the form:<br />
The a and P values are the coefficients to be estimated in such models.<br />
Note that y can take only positive values in such models (Agresti A (1996)<br />
An introduction to categorical data analysis. John Wiley, New York).<br />
Longitudinal study (see a/so under Cohort study)<br />
A study in which subjects are recruited and followed up forward in time,<br />
usually over many months or years. For example, in such a study, diabetic<br />
patients may be followed over a period <strong>of</strong> years to investigate how good<br />
blood glucose control affects the likelihood <strong>of</strong> complications, such as<br />
cataracts or peripheral neuropathy, developing.<br />
Lorenz curve<br />
The Lorenz curve is a useful graphical method, invented by a 19th century<br />
German statistician for depicting the distribution <strong>of</strong> income in a population.<br />
If one were to plot the cumulative proportion <strong>of</strong> total income versus<br />
the cumulative proportion <strong>of</strong> income recipients in a population, we would<br />
observe a straight line with unit slope, given perfect equality in income<br />
among individuals (Figure 14). The line will curve downwards if the income<br />
distribution is unequal and the more unequal the distribution, the<br />
further the curve will be from the diagonal (Brown WS (1995) Principles<br />
<strong>of</strong> economics. West Publishing Company, Minneapolis). The Lorenz curve<br />
can be used to calculate a coefficient <strong>of</strong> inequality, referred to as the Gini<br />
coefficient. This is the ratio <strong>of</strong> the area between the line <strong>of</strong> equality and the<br />
Lorenz curve (area A) and the area below the line <strong>of</strong> equality (areas A + B).<br />
The Gini coefficient has a useful quantitative economic interpretation. A<br />
value <strong>of</strong> 0.25 can be interpreted as meaning that if two incomes are drawn


