Dictionary of Evidence-based Medicine.pdf
Dictionary of Evidence-based Medicine.pdf
Dictionary of Evidence-based Medicine.pdf

You also want an ePaper? Increase the reach of your titles
YUMPU automatically turns print PDFs into web optimized ePapers that Google loves.
84 <strong>Dictionary</strong> <strong>of</strong> <strong>Evidence</strong>-<strong>based</strong> <strong>Medicine</strong><br />
In incremental cost-effectiveness analysis, estimated incremental costs<br />
are divided by the estimated incremental number <strong>of</strong> effectiveness units to<br />
give an incremental cost-effectiveness ratio (CER). In a multitreatment<br />
comparison, the incremental CER should be calculated relative to the next<br />
most effective mutually exclusive alternative (see Dominance) (Weinstein<br />
MC, Zeckhauser R (1973) Clinical ratios and efficient allocation. Journal <strong>of</strong><br />
Public Economics. 2:147-57).<br />
IND<br />
An IND is an investigational new drug in relation to drug licence applications<br />
to the US Food and Drug Administration.<br />
Index date<br />
In a case-control study, subjects are recruited to identify association<br />
between an adverse event (e.g. pulmonary hypertension) and exposure to<br />
a putative risk factor (e.g. anorectic agents). Cases (e.g. patients with<br />
pulmonary hypertension) identified and matched controls are then interviewed<br />
to assess exposure to the risk factor (e.g. anorectic drugs) and<br />
presence <strong>of</strong> confounding factors (e.g. high body mass index, drug abuse or<br />
smoking). The index date is the date from which the cases and controls<br />
recruited are asked to recall their exposure history to the various risk<br />
factors (e.g. date from which they first perceived a symptom such as dyspnoea<br />
in assessing pulmonary hypertension).<br />
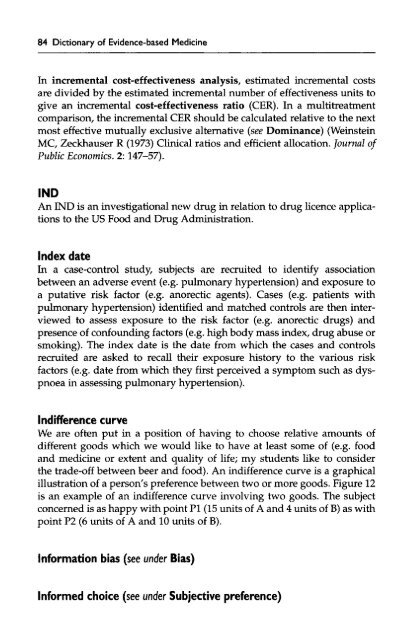
Indifference curve<br />
We are <strong>of</strong>ten put in a position <strong>of</strong> having to choose relative amounts <strong>of</strong><br />
different goods which we would like to have at least some <strong>of</strong> (e.g. food<br />
and medicine or extent and quality <strong>of</strong> life; my students like to consider<br />
the trade-<strong>of</strong>f between beer and food). An indifference curve is a graphical<br />
illustration <strong>of</strong> a person's preference between two or more goods. Figure 12<br />
is an example <strong>of</strong> an indifference curve involving two goods. The subject<br />
concerned is as happy with point PI (15 units <strong>of</strong> A and 4 units <strong>of</strong> B) as with<br />
point P2 (6 units <strong>of</strong> A and 10 units <strong>of</strong> B).<br />
Information bias (see under Bias)<br />
Informed choice (see under Subjective preference)