NATIONAL LABOR RELATIONS BOARD
NATIONAL LABOR RELATIONS BOARD
NATIONAL LABOR RELATIONS BOARD
Create successful ePaper yourself
Turn your PDF publications into a flip-book with our unique Google optimized e-Paper software.
•<br />
2 THIRD ANNUAL REPORT OF <strong>NATIONAL</strong> <strong>LABOR</strong> <strong>RELATIONS</strong> <strong>BOARD</strong><br />
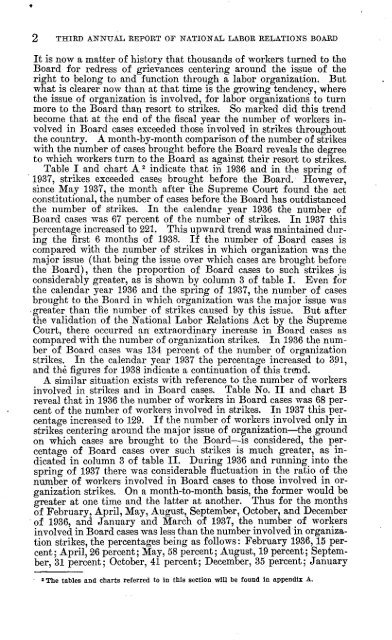
It is now a matter of history that thousands of workers turned to the<br />
Board for redress of grievances centering around the issue of the<br />
right to belong to and function through a labor organization. But<br />
what is clearer now than at that time is the growing tendency, where<br />
the issue of organization is involved, for labor organizations to turn<br />
more to the Board than resort to strikes. So marked did this trend<br />
become that at the end of the fiscal year the number of workers involved<br />
in Board cases exceeded those involved in strikes throughout<br />
the country. A month-by-month comparison of the number of strikes<br />
with the number of cases brought before the Board reveals the degree<br />
to which workers turn to the Board as against their resort to strikes.<br />
Table I and chart A. 2 indicate that in 1936 and in the spring of<br />
1937, strikes exceeded cases brought before the Board. However,<br />
since May 1937, the month after the Supreme Court found the act<br />
constitutional, the number of cases before the Board has outdistanced<br />
the number of strikes. In the calendar year 1936 the number of<br />
Board cases was 67 percent of the number of strikes. In 1937 this<br />
percentage increased to 221. This upward trend was maintained during<br />
the first 6 months of 1938. If the number of Board cases is<br />
compared with the number of strikes in which organization was the<br />
major issue (that being the issue over which cases are brought before<br />
the Board), then the proportion of Board cases to such strikes is<br />
considerably greater, as is shown by column 3 of table I. Even for<br />
the calendar year 1936 and the spring of 1937, the number of cases<br />
brought to the Board in which organization was the major issue was<br />
greater than the number of strikes caused by this issue. But after<br />
the validation of the National Labor Relations Act by the Supreme<br />
Court, there occurred an extraordinary increase in Board cases as<br />
compared with the number of organization strikes. In 1936 the number<br />
of Board cases was 134 percent of the number of organization<br />
strikes. In the calendar year 1937 the percentage increased to 391,<br />
and the figures for 1938 indicate a continuation of this trend.<br />
A similar situation exists with reference to the number of workers<br />
involved in strikes and in Board cases. Table No. II and chart B<br />
reveal that in 1936 the number of workers in Board cases was 68 percent<br />
of the number of workers involved in strikes. In 1937 this percentage<br />
increased to 129. If the number of workers involved only in<br />
strikes centering around the major issue of organization—the ground<br />
on which cases are brought to the Board—is considered, the percentage<br />
of Board cases over such strikes is much greater, as indicated<br />
in column 3 of table II. During 1936 and running into the<br />
spring of 1937 there was considerable fluctuation in the ratio of the<br />
number of workers involved in Board cases to those involved in organization<br />
strikes. On a month-to-month basis, the former would be<br />
greater at one time and the latter at another. Thus for the months<br />
of February, April, May, August, September, October, and December<br />
• of 1936, and January and March of 1937, the number of workers<br />
involved in Board cases was less than the number involved in organization<br />
strikes, the percentages being as follows: February 1936, 15 percent;<br />
April, 26 percent; May, 58 percent; August, 19 percent; September,<br />
31 percent; October, 41 percent; December, 35 percent; January<br />
2 The tables and charts referred to in this section will be found in appendix A.


