- Page 2 and 3:
THE FRONTIERS COLLECTION
- Page 4 and 5:
Bernhard Graimann · Brendan Alliso
- Page 6 and 7:
Preface It’s an exciting time to
- Page 8 and 9:
Contents Brain-Computer Interfaces:
- Page 10 and 11:
Contributors Brendan Allison Instit
- Page 12 and 13:
Contributors xi Femke Nijboer Insti
- Page 14 and 15:
List of Abbreviations ADHD Attentio
- Page 16 and 17:
Brain-Computer Interfaces: A Gentle
- Page 18 and 19:
Brain-Computer Interfaces: A Gentle
- Page 20 and 21:
Brain-Computer Interfaces: A Gentle
- Page 22 and 23:
Brain-Computer Interfaces: A Gentle
- Page 24 and 25:
Brain-Computer Interfaces: A Gentle
- Page 26 and 27:
Brain-Computer Interfaces: A Gentle
- Page 28 and 29:
Brain-Computer Interfaces: A Gentle
- Page 30 and 31:
Brain-Computer Interfaces: A Gentle
- Page 32 and 33:
Brain-Computer Interfaces: A Gentle
- Page 34 and 35:
Brain-Computer Interfaces: A Gentle
- Page 36 and 37:
Brain-Computer Interfaces: A Gentle
- Page 38 and 39:
Brain-Computer Interfaces: A Gentle
- Page 40 and 41:
Brain-Computer Interfaces: A Gentle
- Page 42 and 43:
Brain-Computer Interfaces: A Gentle
- Page 44 and 45:
30 J.R. Wolpaw and C.B. Boulay by b
- Page 46 and 47:
32 J.R. Wolpaw and C.B. Boulay 2 Br
- Page 48 and 49:
34 J.R. Wolpaw and C.B. Boulay Fig.
- Page 50 and 51:
36 J.R. Wolpaw and C.B. Boulay Sens
- Page 52 and 53:
38 J.R. Wolpaw and C.B. Boulay pote
- Page 54 and 55:
40 J.R. Wolpaw and C.B. Boulay EEG-
- Page 56 and 57:
42 J.R. Wolpaw and C.B. Boulay 29.
- Page 58 and 59:
44 J.R. Wolpaw and C.B. Boulay 72.
- Page 60 and 61:
46 J.R. Wolpaw and C.B. Boulay 117.
- Page 62 and 63:
48 G. Pfurtscheller and C. Neuper F
- Page 64 and 65:
50 G. Pfurtscheller and C. Neuper F
- Page 66 and 67:
52 G. Pfurtscheller and C. Neuper r
- Page 68 and 69:
54 G. Pfurtscheller and C. Neuper 6
- Page 70 and 71:
56 G. Pfurtscheller and C. Neuper B
- Page 72 and 73:
58 G. Pfurtscheller and C. Neuper F
- Page 74 and 75:
60 G. Pfurtscheller and C. Neuper 4
- Page 76 and 77:
62 G. Pfurtscheller and C. Neuper 4
- Page 78 and 79:
64 G. Pfurtscheller and C. Neuper 9
- Page 80 and 81:
66 C. Neuper and G. Pfurtscheller s
- Page 82 and 83:
68 C. Neuper and G. Pfurtscheller 2
- Page 84 and 85:
70 C. Neuper and G. Pfurtscheller F
- Page 86 and 87:
72 C. Neuper and G. Pfurtscheller b
- Page 88 and 89:
74 C. Neuper and G. Pfurtscheller E
- Page 90 and 91:
76 C. Neuper and G. Pfurtscheller 1
- Page 92 and 93:
78 C. Neuper and G. Pfurtscheller 5
- Page 94 and 95:
80 G. Pfurtscheller et al. mode, th
- Page 96 and 97:
82 G. Pfurtscheller et al. Therefor
- Page 98 and 99:
84 G. Pfurtscheller et al. A B C 1
- Page 100 and 101:
86 G. Pfurtscheller et al. filters
- Page 102 and 103:
88 G. Pfurtscheller et al. differen
- Page 104 and 105:
90 G. Pfurtscheller et al. In this
- Page 106 and 107:
92 G. Pfurtscheller et al. Fig. 8 P
- Page 108 and 109:
94 G. Pfurtscheller et al. 10. D. F
- Page 110 and 111:
96 G. Pfurtscheller et al. 51. G. P
- Page 112 and 113:
98 E.W. Sellers et al. Fig. 1 Three
- Page 114 and 115:
100 E.W. Sellers et al. Fig. 3 Two-
- Page 116 and 117:
102 E.W. Sellers et al. Fig. 5 Comp
- Page 118 and 119:
104 E.W. Sellers et al. Fig. 7 Mont
- Page 120 and 121:
106 E.W. Sellers et al. fixation wa
- Page 122 and 123:
108 E.W. Sellers et al. 5 SMR-Based
- Page 124 and 125: 110 E.W. Sellers et al. 22. D.J Kru
- Page 126 and 127: Detecting Mental States by Machine
- Page 128 and 129: Detecting Mental States by Machine
- Page 130 and 131: Detecting Mental States by Machine
- Page 132 and 133: Detecting Mental States by Machine
- Page 134 and 135: Detecting Mental States by Machine
- Page 136 and 137: Detecting Mental States by Machine
- Page 138 and 139: Detecting Mental States by Machine
- Page 140 and 141: Detecting Mental States by Machine
- Page 142 and 143: Detecting Mental States by Machine
- Page 144 and 145: Detecting Mental States by Machine
- Page 146 and 147: Detecting Mental States by Machine
- Page 148 and 149: Detecting Mental States by Machine
- Page 150 and 151: 138 Y. Wang et al. which has been e
- Page 152 and 153: 140 Y. Wang et al. After many studi
- Page 154 and 155: 142 Y. Wang et al. Left Hand Right
- Page 156 and 157: 144 Y. Wang et al. 0-degree 60-degr
- Page 158 and 159: 146 Y. Wang et al. 3.1.2 Stimulatio
- Page 160 and 161: 148 Y. Wang et al. Foot 1 0.5 Left
- Page 162 and 163: 150 Y. Wang et al. be summarized as
- Page 164 and 165: 152 Y. Wang et al. Fig. 10 A player
- Page 166 and 167: 154 Y. Wang et al. 22. Y. Wang, R.
- Page 168 and 169: 156 N. Birbaumer and P. Sauseng C A
- Page 170 and 171: 158 N. Birbaumer and P. Sauseng 3 B
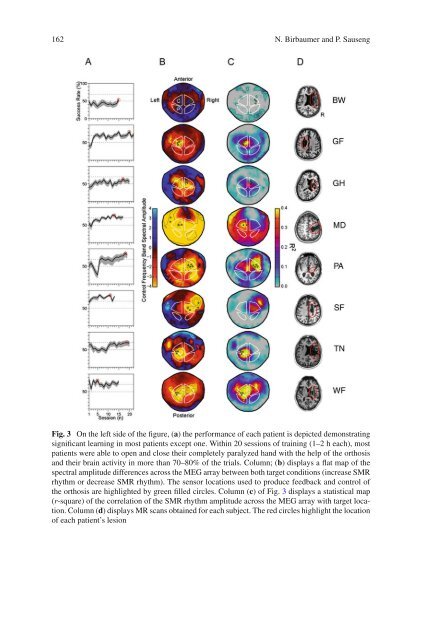
- Page 172 and 173: 160 N. Birbaumer and P. Sauseng pat
- Page 176 and 177: 164 N. Birbaumer and P. Sauseng of
- Page 178 and 179: 166 N. Birbaumer and P. Sauseng Neu
- Page 180 and 181: 168 N. Birbaumer and P. Sauseng 8.
- Page 182 and 183: Non Invasive BCIs for Neuroprosthes
- Page 184 and 185: Non Invasive BCIs for Neuroprosthes
- Page 186 and 187: Non Invasive BCIs for Neuroprosthes
- Page 188 and 189: Non Invasive BCIs for Neuroprosthes
- Page 190 and 191: Non Invasive BCIs for Neuroprosthes
- Page 192 and 193: Non Invasive BCIs for Neuroprosthes
- Page 194 and 195: Non Invasive BCIs for Neuroprosthes
- Page 196 and 197: Brain-Computer Interfaces for Commu
- Page 198 and 199: Brain-Computer Interfaces for Commu
- Page 200 and 201: Brain-Computer Interfaces for Commu
- Page 202 and 203: Brain-Computer Interfaces for Commu
- Page 204 and 205: Brain-Computer Interfaces for Commu
- Page 206 and 207: Brain-Computer Interfaces for Commu
- Page 208 and 209: Brain-Computer Interfaces for Commu
- Page 210 and 211: Brain-Computer Interfaces for Commu
- Page 212 and 213: Brain-Computer Interfaces for Commu
- Page 214 and 215: 204 D.M. Taylor and M.E. Stetner mo
- Page 216 and 217: 206 D.M. Taylor and M.E. Stetner el
- Page 218 and 219: 208 D.M. Taylor and M.E. Stetner ac
- Page 220 and 221: 210 D.M. Taylor and M.E. Stetner de
- Page 222 and 223: 212 D.M. Taylor and M.E. Stetner Ma
- Page 224 and 225:
214 D.M. Taylor and M.E. Stetner pe
- Page 226 and 227:
216 D.M. Taylor and M.E. Stetner ev
- Page 228 and 229:
218 D.M. Taylor and M.E. Stetner fo
- Page 230 and 231:
BCIs Based on Signals from Between
- Page 232 and 233:
BCIs Based on Signals from Between
- Page 234 and 235:
BCIs Based on Signals from Between
- Page 236 and 237:
BCIs Based on Signals from Between
- Page 238 and 239:
BCIs Based on Signals from Between
- Page 240 and 241:
BCIs Based on Signals from Between
- Page 242 and 243:
BCIs Based on Signals from Between
- Page 244 and 245:
BCIs Based on Signals from Between
- Page 246 and 247:
BCIs Based on Signals from Between
- Page 248 and 249:
BCIs Based on Signals from Between
- Page 250 and 251:
242 K.J. Miller and J.G. Ojemann 2
- Page 252 and 253:
244 K.J. Miller and J.G. Ojemann ha
- Page 254 and 255:
246 K.J. Miller and J.G. Ojemann Fi
- Page 256 and 257:
248 K.J. Miller and J.G. Ojemann Fi
- Page 258 and 259:
250 K.J. Miller and J.G. Ojemann fo
- Page 260 and 261:
252 K.J. Miller and J.G. Ojemann me
- Page 262 and 263:
254 K.J. Miller and J.G. Ojemann In
- Page 264 and 265:
256 K.J. Miller and J.G. Ojemann ar
- Page 266 and 267:
258 K.J. Miller and J.G. Ojemann 26
- Page 268 and 269:
260 J. Mellinger and G. Schalk mapp
- Page 270 and 271:
262 J. Mellinger and G. Schalk 2 BC
- Page 272 and 273:
264 J. Mellinger and G. Schalk Fig.
- Page 274 and 275:
266 J. Mellinger and G. Schalk Filt
- Page 276 and 277:
268 J. Mellinger and G. Schalk proc
- Page 278 and 279:
270 J. Mellinger and G. Schalk exis
- Page 280 and 281:
272 J. Mellinger and G. Schalk reco
- Page 282 and 283:
274 J. Mellinger and G. Schalk Fig.
- Page 284 and 285:
276 J. Mellinger and G. Schalk numb
- Page 286 and 287:
278 J. Mellinger and G. Schalk 5. A
- Page 288 and 289:
The First Commercial Brain-Computer
- Page 290 and 291:
The First Commercial Brain-Computer
- Page 292 and 293:
The First Commercial Brain-Computer
- Page 294 and 295:
The First Commercial Brain-Computer
- Page 296 and 297:
The First Commercial Brain-Computer
- Page 298 and 299:
The First Commercial Brain-Computer
- Page 300 and 301:
The First Commercial Brain-Computer
- Page 302 and 303:
The First Commercial Brain-Computer
- Page 304 and 305:
The First Commercial Brain-Computer
- Page 306 and 307:
The First Commercial Brain-Computer
- Page 308 and 309:
The First Commercial Brain-Computer
- Page 310 and 311:
The First Commercial Brain-Computer
- Page 312 and 313:
306 Y. Li et al. Fig. 1 Basic desig
- Page 314 and 315:
308 Y. Li et al. Fig. 2 A linear tr
- Page 316 and 317:
310 Y. Li et al. The large Laplacia
- Page 318 and 319:
312 Y. Li et al. components is larg
- Page 320 and 321:
314 Y. Li et al. P300-based, and ER
- Page 322 and 323:
316 Y. Li et al. 3.3.2 Autoregressi
- Page 324 and 325:
318 Y. Li et al. selection as follo
- Page 326 and 327:
320 Y. Li et al. 5.1.2 Support Vect
- Page 328 and 329:
322 Y. Li et al. is small and the n
- Page 330 and 331:
324 Y. Li et al. (ROC) analysis app
- Page 332 and 333:
326 Y. Li et al. Fig. 10 The stimul
- Page 334 and 335:
328 Y. Li et al. 6. M. Cheng, X. Ga
- Page 336 and 337:
330 Y. Li et al. 46. K. Crammer and
- Page 338 and 339:
332 A. Schlögl et al. Fig. 1 Schem
- Page 340 and 341:
334 A. Schlögl et al. For the rect
- Page 342 and 343:
336 A. Schlögl et al. whereby T in
- Page 344 and 345:
338 A. Schlögl et al. Fig. 2 State
- Page 346 and 347:
340 A. Schlögl et al. yk = a1 · y
- Page 348 and 349:
342 A. Schlögl et al. d{i}(x) = ((
- Page 350 and 351:
344 A. Schlögl et al. Accordingly,
- Page 352 and 353:
346 A. Schlögl et al. not exceed a
- Page 354 and 355:
348 A. Schlögl et al. Error [%] RL
- Page 356 and 357:
350 A. Schlögl et al. Table 3 Aver
- Page 358 and 359:
352 A. Schlögl et al. The extended
- Page 360 and 361:
354 A. Schlögl et al. 24. N.G. Pfu
- Page 362 and 363:
Toward Ubiquitous BCIs Brendan Z. A
- Page 364 and 365:
Toward Ubiquitous BCIs 359 BCI Chal
- Page 366 and 367:
Toward Ubiquitous BCIs 361 communic
- Page 368 and 369:
Toward Ubiquitous BCIs 363 facial m
- Page 370 and 371:
Toward Ubiquitous BCIs 365 The best
- Page 372 and 373:
Toward Ubiquitous BCIs 367 Across a
- Page 374 and 375:
Toward Ubiquitous BCIs 369 the ques
- Page 376 and 377:
Toward Ubiquitous BCIs 371 controll
- Page 378 and 379:
Toward Ubiquitous BCIs 373 controls
- Page 380 and 381:
Toward Ubiquitous BCIs 375 hair in
- Page 382 and 383:
Toward Ubiquitous BCIs 377 Table 1
- Page 384 and 385:
Toward Ubiquitous BCIs 379 conversa
- Page 386 and 387:
Toward Ubiquitous BCIs 381 may down
- Page 388 and 389:
Toward Ubiquitous BCIs 383 physicis
- Page 390 and 391:
Toward Ubiquitous BCIs 385 31. F.H.
- Page 392 and 393:
Toward Ubiquitous BCIs 387 67. G. S
- Page 394 and 395:
390 Index 65, 157, 163, 217, 221-23
- Page 396 and 397:
392 Index 208, 236, 243, 245, 260-2