IPCC_Managing Risks of Extreme Events.pdf - Climate Access
IPCC_Managing Risks of Extreme Events.pdf - Climate Access
IPCC_Managing Risks of Extreme Events.pdf - Climate Access
You also want an ePaper? Increase the reach of your titles
YUMPU automatically turns print PDFs into web optimized ePapers that Google loves.
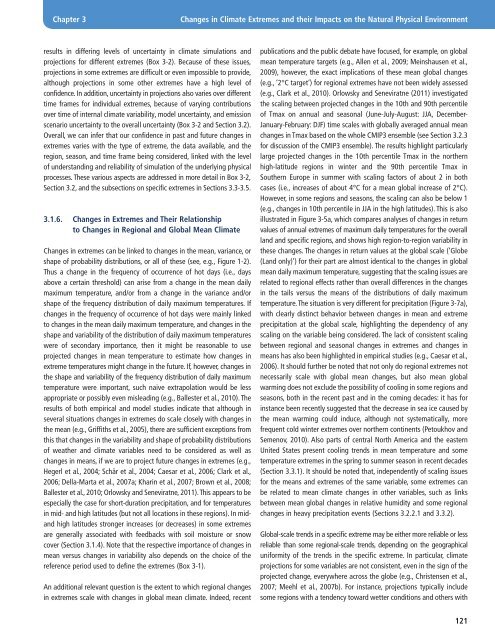
Chapter 3Changes in <strong>Climate</strong> <strong>Extreme</strong>s and their Impacts on the Natural Physical Environmentresults in differing levels <strong>of</strong> uncertainty in climate simulations andprojections for different extremes (Box 3-2). Because <strong>of</strong> these issues,projections in some extremes are difficult or even impossible to provide,although projections in some other extremes have a high level <strong>of</strong>confidence. In addition, uncertainty in projections also varies over differenttime frames for individual extremes, because <strong>of</strong> varying contributionsover time <strong>of</strong> internal climate variability, model uncertainty, and emissionscenario uncertainty to the overall uncertainty (Box 3-2 and Section 3.2).Overall, we can infer that our confidence in past and future changes inextremes varies with the type <strong>of</strong> extreme, the data available, and theregion, season, and time frame being considered, linked with the level<strong>of</strong> understanding and reliability <strong>of</strong> simulation <strong>of</strong> the underlying physicalprocesses. These various aspects are addressed in more detail in Box 3-2,Section 3.2, and the subsections on specific extremes in Sections 3.3-3.5.3.1.6. Changes in <strong>Extreme</strong>s and Their Relationshipto Changes in Regional and Global Mean <strong>Climate</strong>Changes in extremes can be linked to changes in the mean, variance, orshape <strong>of</strong> probability distributions, or all <strong>of</strong> these (see, e.g., Figure 1-2).Thus a change in the frequency <strong>of</strong> occurrence <strong>of</strong> hot days (i.e., daysabove a certain threshold) can arise from a change in the mean dailymaximum temperature, and/or from a change in the variance and/orshape <strong>of</strong> the frequency distribution <strong>of</strong> daily maximum temperatures. Ifchanges in the frequency <strong>of</strong> occurrence <strong>of</strong> hot days were mainly linkedto changes in the mean daily maximum temperature, and changes in theshape and variability <strong>of</strong> the distribution <strong>of</strong> daily maximum temperatureswere <strong>of</strong> secondary importance, then it might be reasonable to useprojected changes in mean temperature to estimate how changes inextreme temperatures might change in the future. If, however, changes inthe shape and variability <strong>of</strong> the frequency distribution <strong>of</strong> daily maximumtemperature were important, such naive extrapolation would be lessappropriate or possibly even misleading (e.g., Ballester et al., 2010). Theresults <strong>of</strong> both empirical and model studies indicate that although inseveral situations changes in extremes do scale closely with changes inthe mean (e.g., Griffiths et al., 2005), there are sufficient exceptions fromthis that changes in the variability and shape <strong>of</strong> probability distributions<strong>of</strong> weather and climate variables need to be considered as well aschanges in means, if we are to project future changes in extremes (e.g.,Hegerl et al., 2004; Schär et al., 2004; Caesar et al., 2006; Clark et al.,2006; Della-Marta et al., 2007a; Kharin et al., 2007; Brown et al., 2008;Ballester et al., 2010; Orlowsky and Seneviratne, 2011). This appears to beespecially the case for short-duration precipitation, and for temperaturesin mid- and high latitudes (but not all locations in these regions). In midandhigh latitudes stronger increases (or decreases) in some extremesare generally associated with feedbacks with soil moisture or snowcover (Section 3.1.4). Note that the respective importance <strong>of</strong> changes inmean versus changes in variability also depends on the choice <strong>of</strong> thereference period used to define the extremes (Box 3-1).An additional relevant question is the extent to which regional changesin extremes scale with changes in global mean climate. Indeed, recentpublications and the public debate have focused, for example, on globalmean temperature targets (e.g., Allen et al., 2009; Meinshausen et al.,2009), however, the exact implications <strong>of</strong> these mean global changes(e.g., ‘2°C target’) for regional extremes have not been widely assessed(e.g., Clark et al., 2010). Orlowsky and Seneviratne (2011) investigatedthe scaling between projected changes in the 10th and 90th percentile<strong>of</strong> Tmax on annual and seasonal (June-July-August: JJA, December-January-February: DJF) time scales with globally averaged annual meanchanges in Tmax based on the whole CMIP3 ensemble (see Section 3.2.3for discussion <strong>of</strong> the CMIP3 ensemble). The results highlight particularlylarge projected changes in the 10th percentile Tmax in the northernhigh-latitude regions in winter and the 90th percentile Tmax inSouthern Europe in summer with scaling factors <strong>of</strong> about 2 in bothcases (i.e., increases <strong>of</strong> about 4°C for a mean global increase <strong>of</strong> 2°C).However, in some regions and seasons, the scaling can also be below 1(e.g., changes in 10th percentile in JJA in the high latitudes). This is alsoillustrated in Figure 3-5a, which compares analyses <strong>of</strong> changes in returnvalues <strong>of</strong> annual extremes <strong>of</strong> maximum daily temperatures for the overallland and specific regions, and shows high region-to-region variability inthese changes. The changes in return values at the global scale (‘Globe(Land only)’) for their part are almost identical to the changes in globalmean daily maximum temperature, suggesting that the scaling issues arerelated to regional effects rather than overall differences in the changesin the tails versus the means <strong>of</strong> the distributions <strong>of</strong> daily maximumtemperature. The situation is very different for precipitation (Figure 3-7a),with clearly distinct behavior between changes in mean and extremeprecipitation at the global scale, highlighting the dependency <strong>of</strong> anyscaling on the variable being considered. The lack <strong>of</strong> consistent scalingbetween regional and seasonal changes in extremes and changes inmeans has also been highlighted in empirical studies (e.g., Caesar et al.,2006). It should further be noted that not only do regional extremes notnecessarily scale with global mean changes, but also mean globalwarming does not exclude the possibility <strong>of</strong> cooling in some regions andseasons, both in the recent past and in the coming decades: it has forinstance been recently suggested that the decrease in sea ice caused bythe mean warming could induce, although not systematically, morefrequent cold winter extremes over northern continents (Petoukhov andSemenov, 2010). Also parts <strong>of</strong> central North America and the easternUnited States present cooling trends in mean temperature and sometemperature extremes in the spring to summer season in recent decades(Section 3.3.1). It should be noted that, independently <strong>of</strong> scaling issuesfor the means and extremes <strong>of</strong> the same variable, some extremes canbe related to mean climate changes in other variables, such as linksbetween mean global changes in relative humidity and some regionalchanges in heavy precipitation events (Sections 3.2.2.1 and 3.3.2).Global-scale trends in a specific extreme may be either more reliable or lessreliable than some regional-scale trends, depending on the geographicaluniformity <strong>of</strong> the trends in the specific extreme. In particular, climateprojections for some variables are not consistent, even in the sign <strong>of</strong> theprojected change, everywhere across the globe (e.g., Christensen et al.,2007; Meehl et al., 2007b). For instance, projections typically includesome regions with a tendency toward wetter conditions and others with121


