IPCC_Managing Risks of Extreme Events.pdf - Climate Access
IPCC_Managing Risks of Extreme Events.pdf - Climate Access
IPCC_Managing Risks of Extreme Events.pdf - Climate Access

Create successful ePaper yourself
Turn your PDF publications into a flip-book with our unique Google optimized e-Paper software.
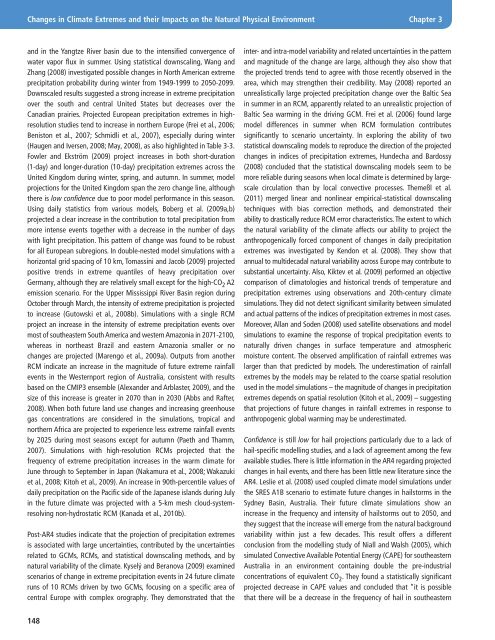
Changes in <strong>Climate</strong> <strong>Extreme</strong>s and their Impacts on the Natural Physical EnvironmentChapter 3and in the Yangtze River basin due to the intensified convergence <strong>of</strong>water vapor flux in summer. Using statistical downscaling, Wang andZhang (2008) investigated possible changes in North American extremeprecipitation probability during winter from 1949-1999 to 2050-2099.Downscaled results suggested a strong increase in extreme precipitationover the south and central United States but decreases over theCanadian prairies. Projected European precipitation extremes in highresolutionstudies tend to increase in northern Europe (Frei et al., 2006;Beniston et al., 2007; Schmidli et al., 2007), especially during winter(Haugen and Iversen, 2008; May, 2008), as also highlighted in Table 3-3.Fowler and Ekström (2009) project increases in both short-duration(1-day) and longer-duration (10-day) precipitation extremes across theUnited Kingdom during winter, spring, and autumn. In summer, modelprojections for the United Kingdom span the zero change line, althoughthere is low confidence due to poor model performance in this season.Using daily statistics from various models, Boberg et al. (2009a,b)projected a clear increase in the contribution to total precipitation frommore intense events together with a decrease in the number <strong>of</strong> dayswith light precipitation. This pattern <strong>of</strong> change was found to be robustfor all European subregions. In double-nested model simulations with ahorizontal grid spacing <strong>of</strong> 10 km, Tomassini and Jacob (2009) projectedpositive trends in extreme quantiles <strong>of</strong> heavy precipitation overGermany, although they are relatively small except for the high-CO 2 A2emission scenario. For the Upper Mississippi River Basin region duringOctober through March, the intensity <strong>of</strong> extreme precipitation is projectedto increase (Gutowski et al., 2008b). Simulations with a single RCMproject an increase in the intensity <strong>of</strong> extreme precipitation events overmost <strong>of</strong> southeastern South America and western Amazonia in 2071-2100,whereas in northeast Brazil and eastern Amazonia smaller or nochanges are projected (Marengo et al., 2009a). Outputs from anotherRCM indicate an increase in the magnitude <strong>of</strong> future extreme rainfallevents in the Westernport region <strong>of</strong> Australia, consistent with resultsbased on the CMIP3 ensemble (Alexander and Arblaster, 2009), and thesize <strong>of</strong> this increase is greater in 2070 than in 2030 (Abbs and Rafter,2008). When both future land use changes and increasing greenhousegas concentrations are considered in the simulations, tropical andnorthern Africa are projected to experience less extreme rainfall eventsby 2025 during most seasons except for autumn (Paeth and Thamm,2007). Simulations with high-resolution RCMs projected that thefrequency <strong>of</strong> extreme precipitation increases in the warm climate forJune through to September in Japan (Nakamura et al., 2008; Wakazukiet al., 2008; Kitoh et al., 2009). An increase in 90th-percentile values <strong>of</strong>daily precipitation on the Pacific side <strong>of</strong> the Japanese islands during Julyin the future climate was projected with a 5-km mesh cloud-systemresolvingnon-hydrostatic RCM (Kanada et al., 2010b).Post-AR4 studies indicate that the projection <strong>of</strong> precipitation extremesis associated with large uncertainties, contributed by the uncertaintiesrelated to GCMs, RCMs, and statistical downscaling methods, and bynatural variability <strong>of</strong> the climate. Kyselý and Beranova (2009) examinedscenarios <strong>of</strong> change in extreme precipitation events in 24 future climateruns <strong>of</strong> 10 RCMs driven by two GCMs, focusing on a specific area <strong>of</strong>central Europe with complex orography. They demonstrated that theinter- and intra-model variability and related uncertainties in the patternand magnitude <strong>of</strong> the change are large, although they also show thatthe projected trends tend to agree with those recently observed in thearea, which may strengthen their credibility. May (2008) reported anunrealistically large projected precipitation change over the Baltic Seain summer in an RCM, apparently related to an unrealistic projection <strong>of</strong>Baltic Sea warming in the driving GCM. Frei et al. (2006) found largemodel differences in summer when RCM formulation contributessignificantly to scenario uncertainty. In exploring the ability <strong>of</strong> twostatistical downscaling models to reproduce the direction <strong>of</strong> the projectedchanges in indices <strong>of</strong> precipitation extremes, Hundecha and Bardossy(2008) concluded that the statistical downscaling models seem to bemore reliable during seasons when local climate is determined by largescalecirculation than by local convective processes. Themeßl et al.(2011) merged linear and nonlinear empirical-statistical downscalingtechniques with bias correction methods, and demonstrated theirability to drastically reduce RCM error characteristics. The extent to whichthe natural variability <strong>of</strong> the climate affects our ability to project theanthropogenically forced component <strong>of</strong> changes in daily precipitationextremes was investigated by Kendon et al. (2008). They show thatannual to multidecadal natural variability across Europe may contribute tosubstantial uncertainty. Also, Kiktev et al. (2009) performed an objectivecomparison <strong>of</strong> climatologies and historical trends <strong>of</strong> temperature andprecipitation extremes using observations and 20th-century climatesimulations. They did not detect significant similarity between simulatedand actual patterns <strong>of</strong> the indices <strong>of</strong> precipitation extremes in most cases.Moreover, Allan and Soden (2008) used satellite observations and modelsimulations to examine the response <strong>of</strong> tropical precipitation events tonaturally driven changes in surface temperature and atmosphericmoisture content. The observed amplification <strong>of</strong> rainfall extremes waslarger than that predicted by models. The underestimation <strong>of</strong> rainfallextremes by the models may be related to the coarse spatial resolutionused in the model simulations – the magnitude <strong>of</strong> changes in precipitationextremes depends on spatial resolution (Kitoh et al., 2009) – suggestingthat projections <strong>of</strong> future changes in rainfall extremes in response toanthropogenic global warming may be underestimated.Confidence is still low for hail projections particularly due to a lack <strong>of</strong>hail-specific modelling studies, and a lack <strong>of</strong> agreement among the fewavailable studies. There is little information in the AR4 regarding projectedchanges in hail events, and there has been little new literature since theAR4. Leslie et al. (2008) used coupled climate model simulations underthe SRES A1B scenario to estimate future changes in hailstorms in theSydney Basin, Australia. Their future climate simulations show anincrease in the frequency and intensity <strong>of</strong> hailstorms out to 2050, andthey suggest that the increase will emerge from the natural backgroundvariability within just a few decades. This result <strong>of</strong>fers a differentconclusion from the modelling study <strong>of</strong> Niall and Walsh (2005), whichsimulated Convective Available Potential Energy (CAPE) for southeasternAustralia in an environment containing double the pre-industrialconcentrations <strong>of</strong> equivalent CO 2 . They found a statistically significantprojected decrease in CAPE values and concluded that “it is possiblethat there will be a decrease in the frequency <strong>of</strong> hail in southeastern148