- Page 1:
MANAGING THE RISKS OF EXTREMEEVENTS
- Page 5:
Managing the Risks of Extreme Event
- Page 9 and 10:
I Foreword and Preface
- Page 12 and 13:
Prefacein understanding and managin
- Page 17 and 18:
Summary for PolicymakersBox SPM.1 |
- Page 19 and 20:
Summary for PolicymakersB.or sub-na
- Page 21 and 22:
Summary for PolicymakersIt is likel
- Page 23:
Summary for Policymakersmicro-insur
- Page 27 and 28:
Summary for PolicymakersIt is very
- Page 29 and 30:
Summary for PolicymakersOther low-r
- Page 31 and 32:
Summary for PolicymakersTable SPM.1
- Page 33 and 34:
Summary for PolicymakersBox SPM.2 |
- Page 35:
III Chapters 1 to 9
- Page 38 and 39:
Climate Change: New Dimensions in D
- Page 40 and 41:
Climate Change: New Dimensions in D
- Page 42 and 43:
Climate Change: New Dimensions in D
- Page 44 and 45:
Climate Change: New Dimensions in D
- Page 46 and 47:
Climate Change: New Dimensions in D
- Page 48 and 49:
Climate Change: New Dimensions in D
- Page 50 and 51:
Climate Change: New Dimensions in D
- Page 52 and 53:
Climate Change: New Dimensions in D
- Page 54 and 55:
Climate Change: New Dimensions in D
- Page 56 and 57:
Climate Change: New Dimensions in D
- Page 58 and 59:
Climate Change: New Dimensions in D
- Page 60 and 61:
Climate Change: New Dimensions in D
- Page 62 and 63:
Climate Change: New Dimensions in D
- Page 64 and 65:
Climate Change: New Dimensions in D
- Page 66 and 67:
Climate Change: New Dimensions in D
- Page 68 and 69:
Climate Change: New Dimensions in D
- Page 70 and 71:
Climate Change: New Dimensions in D
- Page 72 and 73:
Climate Change: New Dimensions in D
- Page 74 and 75:
Climate Change: New Dimensions in D
- Page 76 and 77:
Climate Change: New Dimensions in D
- Page 78 and 79:
Determinants of Risk: Exposure and
- Page 80 and 81:
Determinants of Risk: Exposure and
- Page 82 and 83:
Determinants of Risk: Exposure and
- Page 84 and 85:
Determinants of Risk: Exposure and
- Page 86 and 87:
Determinants of Risk: Exposure and
- Page 88 and 89:
Determinants of Risk: Exposure and
- Page 90 and 91:
Determinants of Risk: Exposure and
- Page 92 and 93:
Determinants of Risk: Exposure and
- Page 94 and 95:
Determinants of Risk: Exposure and
- Page 96 and 97:
Determinants of Risk: Exposure and
- Page 98 and 99:
Determinants of Risk: Exposure and
- Page 100 and 101:
Determinants of Risk: Exposure and
- Page 102 and 103:
Determinants of Risk: Exposure and
- Page 104 and 105:
Determinants of Risk: Exposure and
- Page 106 and 107:
Determinants of Risk: Exposure and
- Page 108 and 109:
Determinants of Risk: Exposure and
- Page 110 and 111:
Determinants of Risk: Exposure and
- Page 112 and 113:
Determinants of Risk: Exposure and
- Page 114 and 115:
Determinants of Risk: Exposure and
- Page 116 and 117:
Determinants of Risk: Exposure and
- Page 118 and 119:
Determinants of Risk: Exposure and
- Page 120 and 121:
Determinants of Risk: Exposure and
- Page 122 and 123:
Changes in Climate Extremes and the
- Page 124 and 125:
Changes in Climate Extremes and the
- Page 126 and 127:
Changes in Climate Extremes and the
- Page 128 and 129:
Changes in Climate Extremes and the
- Page 130 and 131:
Changes in Climate Extremes and the
- Page 132 and 133:
Changes in Climate Extremes and the
- Page 134 and 135:
Changes in Climate Extremes and the
- Page 136 and 137:
Changes in Climate Extremes and the
- Page 138 and 139:
Changes in Climate Extremes and the
- Page 140 and 141:
Changes in Climate Extremes and the
- Page 142 and 143:
Changes in Climate Extremes and the
- Page 144 and 145:
Changes in Climate Extremes and the
- Page 146 and 147:
Changes in Climate Extremes and the
- Page 148 and 149:
Changes in Climate Extremes and the
- Page 150 and 151:
138much of the continental United S
- Page 152 and 153:
Changes in Climate Extremes and the
- Page 154 and 155:
Changes in Climate Extremes and the
- Page 156 and 157:
Changes in Climate Extremes and the
- Page 158 and 159:
Changes in Climate Extremes and the
- Page 160 and 161:
Changes in Climate Extremes and the
- Page 162 and 163:
Changes in Climate Extremes and the
- Page 164 and 165:
Changes in Climate Extremes and the
- Page 166 and 167:
Changes in Climate Extremes and the
- Page 168 and 169:
Changes in Climate Extremes and the
- Page 170 and 171:
Changes in Climate Extremes and the
- Page 172 and 173:
Changes in Climate Extremes and the
- Page 174 and 175:
Changes in Climate Extremes and the
- Page 176 and 177:
Changes in Climate Extremes and the
- Page 178 and 179:
Changes in Climate Extremes and the
- Page 180 and 181:
Changes in Climate Extremes and the
- Page 182 and 183:
Changes in Climate Extremes and the
- Page 184 and 185:
Changes in Climate Extremes and the
- Page 186 and 187:
Changes in Climate Extremes and the
- Page 188 and 189:
Changes in Climate Extremes and the
- Page 190 and 191:
Changes in Climate Extremes and the
- Page 192 and 193:
Changes in Climate Extremes and the
- Page 194 and 195:
Changes in Climate Extremes and the
- Page 196 and 197:
Changes in Climate Extremes and the
- Page 198 and 199:
Changes in Climate Extremes and the
- Page 200 and 201:
Changes in Climate Extremes and the
- Page 202 and 203: Changes in Climate Extremes and the
- Page 204 and 205: Changes in Climate Extremes and the
- Page 206 and 207: Changes in Climate Extremes and the
- Page 208 and 209: Changes in Climate Extremes and the
- Page 210 and 211: Changes in Climate Extremes and the
- Page 212 and 213: Changes in Climate Extremes and the
- Page 214 and 215: Changes in Climate Extremes and the
- Page 216 and 217: Changes in Climate Extremes and the
- Page 218 and 219: Changes in Climate Extremes and the
- Page 220 and 221: Changes in Climate Extremes and the
- Page 222 and 223: Changes in Climate Extremes and the
- Page 224 and 225: Changes in Climate Extremes and the
- Page 226 and 227: Changes in Climate Extremes and the
- Page 228 and 229: Changes in Climate Extremes and the
- Page 230 and 231: Changes in Climate Extremes and the
- Page 232 and 233: Changes in Climate Extremes and the
- Page 234 and 235: Changes in Climate Extremes and the
- Page 236 and 237: Changes in Climate Extremes and the
- Page 238 and 239: Changes in Climate Extremes and the
- Page 240 and 241: Changes in Climate Extremes and the
- Page 242 and 243: Changes in Climate Extremes and the
- Page 244 and 245: Changes in Impacts of Climate Extre
- Page 246 and 247: Changes in Impacts of Climate Extre
- Page 248 and 249: Changes in Impacts of Climate Extre
- Page 250 and 251: Changes in Impacts of Climate Extre
- Page 254 and 255: Changes in Impacts of Climate Extre
- Page 256 and 257: Changes in Impacts of Climate Extre
- Page 258 and 259: Changes in Impacts of Climate Extre
- Page 260 and 261: Changes in Impacts of Climate Extre
- Page 262 and 263: Changes in Impacts of Climate Extre
- Page 264 and 265: Changes in Impacts of Climate Extre
- Page 266 and 267: Changes in Impacts of Climate Extre
- Page 268 and 269: Changes in Impacts of Climate Extre
- Page 270 and 271: Changes in Impacts of Climate Extre
- Page 272 and 273: Changes in Impacts of Climate Extre
- Page 274 and 275: Changes in Impacts of Climate Extre
- Page 276 and 277: Changes in Impacts of Climate Extre
- Page 278 and 279: Changes in Impacts of Climate Extre
- Page 280 and 281: Changes in Impacts of Climate Extre
- Page 282 and 283: Changes in Impacts of Climate Extre
- Page 284 and 285: Changes in Impacts of Climate Extre
- Page 286 and 287: Changes in Impacts of Climate Extre
- Page 288 and 289: Changes in Impacts of Climate Extre
- Page 290 and 291: Changes in Impacts of Climate Extre
- Page 292 and 293: Changes in Impacts of Climate Extre
- Page 294 and 295: Changes in Impacts of Climate Extre
- Page 296 and 297: Changes in Impacts of Climate Extre
- Page 298 and 299: Changes in Impacts of Climate Extre
- Page 300 and 301: Changes in Impacts of Climate Extre
- Page 302 and 303:
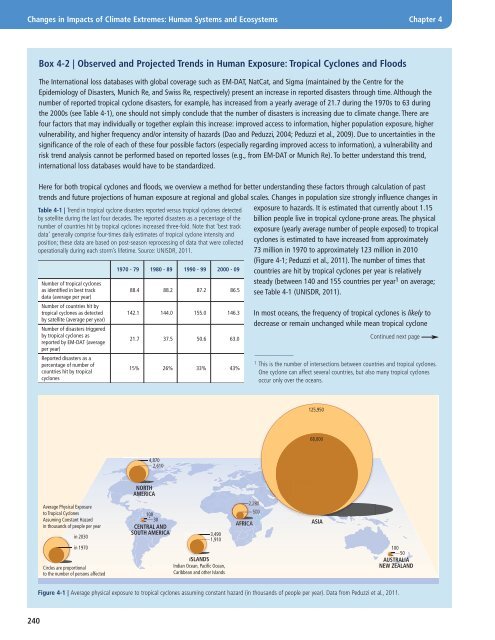
Changes in Impacts of Climate Extre
- Page 304 and 305:
Managing the Risks from Climate Ext
- Page 306 and 307:
Managing the Risks from Climate Ext
- Page 308 and 309:
Managing the Risks from Climate Ext
- Page 310 and 311:
Managing the Risks from Climate Ext
- Page 312 and 313:
Managing the Risks from Climate Ext
- Page 314 and 315:
Managing the Risks from Climate Ext
- Page 316 and 317:
Managing the Risks from Climate Ext
- Page 318 and 319:
Managing the Risks from Climate Ext
- Page 320 and 321:
Managing the Risks from Climate Ext
- Page 322 and 323:
Managing the Risks from Climate Ext
- Page 324 and 325:
Managing the Risks from Climate Ext
- Page 326 and 327:
Managing the Risks from Climate Ext
- Page 328 and 329:
Managing the Risks from Climate Ext
- Page 330 and 331:
Managing the Risks from Climate Ext
- Page 332 and 333:
Managing the Risks from Climate Ext
- Page 334 and 335:
Managing the Risks from Climate Ext
- Page 336 and 337:
Managing the Risks from Climate Ext
- Page 338 and 339:
Managing the Risks from Climate Ext
- Page 340 and 341:
Managing the Risks from Climate Ext
- Page 342 and 343:
Managing the Risks from Climate Ext
- Page 344 and 345:
Managing the Risks from Climate Ext
- Page 346 and 347:
Managing the Risks from Climate Ext
- Page 348 and 349:
Managing the Risks from Climate Ext
- Page 350 and 351:
Managing the Risks from Climate Ext
- Page 352 and 353:
National Systems for Managing the R
- Page 354 and 355:
National Systems for Managing the R
- Page 356 and 357:
National Systems for Managing the R
- Page 358 and 359:
National Systems for Managing the R
- Page 360 and 361:
National Systems for Managing the R
- Page 362 and 363:
National Systems for Managing the R
- Page 364 and 365:
National Systems for Managing the R
- Page 366 and 367:
National Systems for Managing the R
- Page 368 and 369:
National Systems for Managing the R
- Page 370 and 371:
National Systems for Managing the R
- Page 372 and 373:
National Systems for Managing the R
- Page 374 and 375:
National Systems for Managing the R
- Page 376 and 377:
National Systems for Managing the R
- Page 378 and 379:
National Systems for Managing the R
- Page 380 and 381:
National Systems for Managing the R
- Page 382 and 383:
National Systems for Managing the R
- Page 384 and 385:
National Systems for Managing the R
- Page 386 and 387:
National Systems for Managing the R
- Page 388 and 389:
National Systems for Managing the R
- Page 390 and 391:
National Systems for Managing the R
- Page 392 and 393:
National Systems for Managing the R
- Page 394 and 395:
National Systems for Managing the R
- Page 396 and 397:
National Systems for Managing the R
- Page 398 and 399:
National Systems for Managing the R
- Page 400 and 401:
National Systems for Managing the R
- Page 402 and 403:
National Systems for Managing the R
- Page 404 and 405:
National Systems for Managing the R
- Page 406 and 407:
Managing the Risks: International L
- Page 408 and 409:
Managing the Risks: International L
- Page 410 and 411:
Managing the Risks: International L
- Page 412 and 413:
Managing the Risks: International L
- Page 414 and 415:
Managing the Risks: International L
- Page 416 and 417:
Managing the Risks: International L
- Page 418 and 419:
Managing the Risks: International L
- Page 420 and 421:
Managing the Risks: International L
- Page 422 and 423:
Managing the Risks: International L
- Page 424 and 425:
Managing the Risks: International L
- Page 426 and 427:
Managing the Risks: International L
- Page 428 and 429:
Managing the Risks: International L
- Page 430 and 431:
Managing the Risks: International L
- Page 432 and 433:
Managing the Risks: International L
- Page 434 and 435:
Managing the Risks: International L
- Page 436 and 437:
Managing the Risks: International L
- Page 438 and 439:
Managing the Risks: International L
- Page 440 and 441:
Managing the Risks: International L
- Page 442 and 443:
Managing the Risks: International L
- Page 444 and 445:
Managing the Risks: International L
- Page 446 and 447:
Managing the Risks: International L
- Page 448 and 449:
Managing the Risks: International L
- Page 450 and 451:
Toward a Sustainable and Resilient
- Page 452 and 453:
Toward a Sustainable and Resilient
- Page 454 and 455:
Toward a Sustainable and Resilient
- Page 456 and 457:
Toward a Sustainable and Resilient
- Page 458 and 459:
Toward a Sustainable and Resilient
- Page 460 and 461:
Toward a Sustainable and Resilient
- Page 462 and 463:
Toward a Sustainable and Resilient
- Page 464 and 465:
Toward a Sustainable and Resilient
- Page 466 and 467:
Toward a Sustainable and Resilient
- Page 468 and 469:
Toward a Sustainable and Resilient
- Page 470 and 471:
Toward a Sustainable and Resilient
- Page 472 and 473:
Toward a Sustainable and Resilient
- Page 474 and 475:
Toward a Sustainable and Resilient
- Page 476 and 477:
Toward a Sustainable and Resilient
- Page 478 and 479:
Toward a Sustainable and Resilient
- Page 480 and 481:
Toward a Sustainable and Resilient
- Page 482 and 483:
Toward a Sustainable and Resilient
- Page 484 and 485:
Toward a Sustainable and Resilient
- Page 486 and 487:
Toward a Sustainable and Resilient
- Page 488 and 489:
Toward a Sustainable and Resilient
- Page 490 and 491:
Toward a Sustainable and Resilient
- Page 492 and 493:
Toward a Sustainable and Resilient
- Page 494 and 495:
Toward a Sustainable and Resilient
- Page 496 and 497:
Toward a Sustainable and Resilient
- Page 498 and 499:
Toward a Sustainable and Resilient
- Page 500 and 501:
Case StudiesChapter 9Table of Conte
- Page 502 and 503:
Case StudiesChapter 99.1. Introduct
- Page 504 and 505:
Case StudiesChapter 9••••
- Page 506 and 507:
Case StudiesChapter 99.2.1.2.3. Hea
- Page 508 and 509:
Case StudiesChapter 9preparedness c
- Page 510 and 511:
Case StudiesChapter 99.2.2.5. Outco
- Page 512 and 513:
Case StudiesChapter 9practices at b
- Page 514 and 515:
Case StudiesChapter 9to implement s
- Page 516 and 517:
Case StudiesChapter 9lined by the w
- Page 518 and 519:
Case StudiesChapter 94.5 million af
- Page 520 and 521:
Case StudiesChapter 9are typically
- Page 522 and 523:
Case StudiesChapter 9heightens vuln
- Page 524 and 525:
Case StudiesChapter 9multi-hazard r
- Page 526 and 527:
Case StudiesChapter 9Bank, 2005b).
- Page 528 and 529:
Case StudiesChapter 9Some federal-l
- Page 530 and 531:
Case StudiesChapter 9develop in a m
- Page 532 and 533:
Case StudiesChapter 9Most states ha
- Page 534 and 535:
Case StudiesChapter 9reduction legi
- Page 536 and 537:
Case StudiesChapter 9countries. Thr
- Page 538 and 539:
Case StudiesChapter 99.2.14. Educat
- Page 540 and 541:
Case StudiesChapter 9to be removed
- Page 542 and 543:
Case StudiesChapter 9can help to ad
- Page 544 and 545:
Case StudiesChapter 9CRED, 2009: EM
- Page 546 and 547:
Case StudiesChapter 9Hallegatte, S.
- Page 548 and 549:
Case StudiesChapter 9Linnerooth-Bay
- Page 550 and 551:
Case StudiesChapter 9O’Neill, M.S
- Page 552 and 553:
Case StudiesChapter 9Skaff, M. and
- Page 554 and 555:
Case StudiesChapter 9Visser, R. and
- Page 557 and 558:
ANNEXI Authors and Expert Reviewers
- Page 559 and 560:
Annex IAuthors and Expert Reviewers
- Page 561 and 562:
Annex IAuthors and Expert Reviewers
- Page 563 and 564:
Annex IAuthors and Expert Reviewers
- Page 565 and 566:
Annex IAuthors and Expert Reviewers
- Page 567 and 568:
ANNEXIIGlossary of TermsThis annex
- Page 569 and 570:
Annex IIGlossary of Termswater vapo
- Page 571 and 572:
Annex IIGlossary of Termsdrought, a
- Page 573 and 574:
Annex IIGlossary of TermsImpactsEff
- Page 575 and 576:
Annex IIGlossary of Termsforcing is
- Page 577 and 578:
ANNEXIIIAcronyms565
- Page 579 and 580:
Annex IIIAcronymsNAMNAONAPANaTechND
- Page 581 and 582:
ANNEXIVList of Major IPCC Reports56
- Page 583 and 584:
Annex IVList of Major IPCC ReportsC
- Page 585 and 586:
Index573
- Page 587 and 588:
Indexresilience building, 378touris
- Page 589 and 590:
IndexEM-DAT database, 364Emissions
- Page 591 and 592:
Indextransformation and, 324See als
- Page 593 and 594:
IndexRisk sharing, 10-11, 397, 523i


