IPCC_Managing Risks of Extreme Events.pdf - Climate Access
IPCC_Managing Risks of Extreme Events.pdf - Climate Access
IPCC_Managing Risks of Extreme Events.pdf - Climate Access

You also want an ePaper? Increase the reach of your titles
YUMPU automatically turns print PDFs into web optimized ePapers that Google loves.
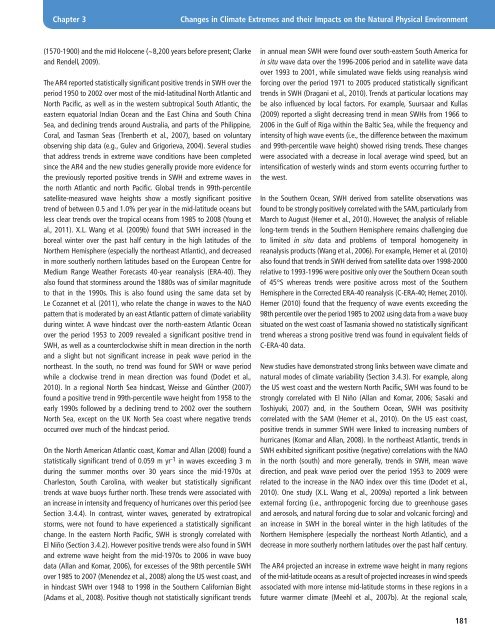
Chapter 3Changes in <strong>Climate</strong> <strong>Extreme</strong>s and their Impacts on the Natural Physical Environment(1570-1900) and the mid Holocene (~8,200 years before present; Clarkeand Rendell, 2009).The AR4 reported statistically significant positive trends in SWH over theperiod 1950 to 2002 over most <strong>of</strong> the mid-latitudinal North Atlantic andNorth Pacific, as well as in the western subtropical South Atlantic, theeastern equatorial Indian Ocean and the East China and South ChinaSea, and declining trends around Australia, and parts <strong>of</strong> the Philippine,Coral, and Tasman Seas (Trenberth et al., 2007), based on voluntaryobserving ship data (e.g., Gulev and Grigorieva, 2004). Several studiesthat address trends in extreme wave conditions have been completedsince the AR4 and the new studies generally provide more evidence forthe previously reported positive trends in SWH and extreme waves inthe north Atlantic and north Pacific. Global trends in 99th-percentilesatellite-measured wave heights show a mostly significant positivetrend <strong>of</strong> between 0.5 and 1.0% per year in the mid-latitude oceans butless clear trends over the tropical oceans from 1985 to 2008 (Young etal., 2011). X.L. Wang et al. (2009b) found that SWH increased in theboreal winter over the past half century in the high latitudes <strong>of</strong> theNorthern Hemisphere (especially the northeast Atlantic), and decreasedin more southerly northern latitudes based on the European Centre forMedium Range Weather Forecasts 40-year reanalysis (ERA-40). Theyalso found that storminess around the 1880s was <strong>of</strong> similar magnitudeto that in the 1990s. This is also found using the same data set byLe Cozannet et al. (2011), who relate the change in waves to the NAOpattern that is moderated by an east Atlantic pattern <strong>of</strong> climate variabilityduring winter. A wave hindcast over the north-eastern Atlantic Oceanover the period 1953 to 2009 revealed a significant positive trend inSWH, as well as a counterclockwise shift in mean direction in the northand a slight but not significant increase in peak wave period in thenortheast. In the south, no trend was found for SWH or wave periodwhile a clockwise trend in mean direction was found (Dodet et al.,2010). In a regional North Sea hindcast, Weisse and Günther (2007)found a positive trend in 99th-percentile wave height from 1958 to theearly 1990s followed by a declining trend to 2002 over the southernNorth Sea, except on the UK North Sea coast where negative trendsoccurred over much <strong>of</strong> the hindcast period.On the North American Atlantic coast, Komar and Allan (2008) found astatistically significant trend <strong>of</strong> 0.059 m yr -1 in waves exceeding 3 mduring the summer months over 30 years since the mid-1970s atCharleston, South Carolina, with weaker but statistically significanttrends at wave buoys further north. These trends were associated withan increase in intensity and frequency <strong>of</strong> hurricanes over this period (seeSection 3.4.4). In contrast, winter waves, generated by extratropicalstorms, were not found to have experienced a statistically significantchange. In the eastern North Pacific, SWH is strongly correlated withEl Niño (Section 3.4.2). However positive trends were also found in SWHand extreme wave height from the mid-1970s to 2006 in wave buoydata (Allan and Komar, 2006), for excesses <strong>of</strong> the 98th percentile SWHover 1985 to 2007 (Menendez et al., 2008) along the US west coast, andin hindcast SWH over 1948 to 1998 in the Southern Californian Bight(Adams et al., 2008). Positive though not statistically significant trendsin annual mean SWH were found over south-eastern South America forin situ wave data over the 1996-2006 period and in satellite wave dataover 1993 to 2001, while simulated wave fields using reanalysis windforcing over the period 1971 to 2005 produced statistically significanttrends in SWH (Dragani et al., 2010). Trends at particular locations maybe also influenced by local factors. For example, Suursaar and Kullas(2009) reported a slight decreasing trend in mean SWHs from 1966 to2006 in the Gulf <strong>of</strong> Riga within the Baltic Sea, while the frequency andintensity <strong>of</strong> high wave events (i.e., the difference between the maximumand 99th-percentile wave height) showed rising trends. These changeswere associated with a decrease in local average wind speed, but anintensification <strong>of</strong> westerly winds and storm events occurring further tothe west.In the Southern Ocean, SWH derived from satellite observations wasfound to be strongly positively correlated with the SAM, particularly fromMarch to August (Hemer et al., 2010). However, the analysis <strong>of</strong> reliablelong-term trends in the Southern Hemisphere remains challenging dueto limited in situ data and problems <strong>of</strong> temporal homogeneity inreanalysis products (Wang et al., 2006). For example, Hemer et al. (2010)also found that trends in SWH derived from satellite data over 1998-2000relative to 1993-1996 were positive only over the Southern Ocean south<strong>of</strong> 45°S whereas trends were positive across most <strong>of</strong> the SouthernHemisphere in the Corrected ERA-40 reanalysis (C-ERA-40; Hemer, 2010).Hemer (2010) found that the frequency <strong>of</strong> wave events exceeding the98th percentile over the period 1985 to 2002 using data from a wave buoysituated on the west coast <strong>of</strong> Tasmania showed no statistically significanttrend whereas a strong positive trend was found in equivalent fields <strong>of</strong>C-ERA-40 data.New studies have demonstrated strong links between wave climate andnatural modes <strong>of</strong> climate variability (Section 3.4.3). For example, alongthe US west coast and the western North Pacific, SWH was found to bestrongly correlated with El Niño (Allan and Komar, 2006; Sasaki andToshiyuki, 2007) and, in the Southern Ocean, SWH was positivitycorrelated with the SAM (Hemer et al., 2010). On the US east coast,positive trends in summer SWH were linked to increasing numbers <strong>of</strong>hurricanes (Komar and Allan, 2008). In the northeast Atlantic, trends inSWH exhibited significant positive (negative) correlations with the NAOin the north (south) and more generally, trends in SWH, mean wavedirection, and peak wave period over the period 1953 to 2009 wererelated to the increase in the NAO index over this time (Dodet et al.,2010). One study (X.L. Wang et al., 2009a) reported a link betweenexternal forcing (i.e., anthropogenic forcing due to greenhouse gasesand aerosols, and natural forcing due to solar and volcanic forcing) andan increase in SWH in the boreal winter in the high latitudes <strong>of</strong> theNorthern Hemisphere (especially the northeast North Atlantic), and adecrease in more southerly northern latitudes over the past half century.The AR4 projected an increase in extreme wave height in many regions<strong>of</strong> the mid-latitude oceans as a result <strong>of</strong> projected increases in wind speedsassociated with more intense mid-latitude storms in these regions in afuture warmer climate (Meehl et al., 2007b). At the regional scale,181