- Page 3:
Economic Reportof the PresidentTran
- Page 7:
ECONOMIC REPORTOF THE PRESIDENT
- Page 10 and 11:
We have heard much about American i
- Page 12 and 13:
at an approach that took account of
- Page 14 and 15:
een due to overall demand in the ec
- Page 16 and 17:
to $27.5 billion in the new budget
- Page 18 and 19:
ductions would amount to over $27 b
- Page 20 and 21:
10 percent inflation rate, keeping
- Page 22 and 23:
tutes for petroleum. The Synthetic
- Page 24 and 25:
esponse can be so large as to wipe
- Page 27:
THE ANNUAL REPORTOF THECOUNCIL OF E
- Page 31 and 32:
CONTENTSCHAPTER 1. INFLATION AND GR
- Page 33 and 34:
PageChallenges to the International
- Page 35 and 36:
CHAPTER 1Inflation and Growth in th
- Page 37 and 38:
needed to control inflation by resi
- Page 39 and 40:
decline in productivity growth may
- Page 41 and 42:
Chart 1Standard Unit Labor CostsPER
- Page 43 and 44:
end of 1974 the world price of oil
- Page 45 and 46:
price decisions cannot easily be re
- Page 47 and 48:
Federal budget achieved a surplus.
- Page 49 and 50:
As an abrupt increase in the price
- Page 51 and 52:
policies but are based on the wides
- Page 53 and 54:
tion, and can policies be designed
- Page 55 and 56:
duction and employment to grow only
- Page 57 and 58:
Moreover, their actions must indica
- Page 59 and 60:
Starting with its 1975 targets as a
- Page 61 and 62:
well after the fact whether the mon
- Page 63 and 64:
Reserve provides some flexibility i
- Page 65 and 66:
in response to circumstances in par
- Page 67 and 68:
Although the flexibility of TIPs ma
- Page 69 and 70:
ard or that thought the administrat
- Page 71 and 72:
given standard, as the reward and t
- Page 73 and 74:
large firms. Even among large firms
- Page 75 and 76:
cause declining productivity growth
- Page 77 and 78:
vanced technology and will therefor
- Page 79 and 80:
ather than restoring the growth of
- Page 81 and 82:
correct some of the distortions in
- Page 83 and 84:
higher than it would otherwise be b
- Page 85 and 86:
EXPECTED PRODUCTIVITY GAINSAlthough
- Page 87 and 88:
supply of adult men in the work for
- Page 89 and 90:
increase demand pressures, especial
- Page 91 and 92:
time hours also has drawbacks. For
- Page 93 and 94:
eintroduce the problem of changing
- Page 95 and 96:
CHAPTER 2Improving the Adaptability
- Page 97 and 98:
use less and produce more energy in
- Page 99 and 100:
expectation of price controls or fu
- Page 101 and 102:
dependence on foreign oil mean that
- Page 103 and 104:
While the market solution might pro
- Page 105 and 106:
High energy prices and excessive de
- Page 107 and 108:
part, the interests of these partie
- Page 109 and 110:
Federal regulations designed to pro
- Page 111 and 112:
Agency (EPA) from considering prosp
- Page 113 and 114:
other things, that federally assist
- Page 115 and 116:
ing services. Money-market mutual f
- Page 117 and 118:
holdings of consumer and business l
- Page 119 and 120:
they once had and thus cannot conti
- Page 121 and 122:
finding ways around outdated regula
- Page 123 and 124:
proportion of the existing farms pr
- Page 125 and 126:
prices for years in the future, reg
- Page 127 and 128:
derground water resources once thou
- Page 129 and 130:
comprehensive, actuarial crop insur
- Page 131 and 132:
duced a decline in the median age o
- Page 133 and 134:
elude government investments in loc
- Page 135 and 136:
some of the firms in the chosen sec
- Page 137 and 138:
CHAPTER 3The Economy: Review and Pr
- Page 139 and 140:
uild up oil inventories and maintai
- Page 141 and 142:
Chart 7Selected Interest Ratesand B
- Page 143 and 144:
had risen just 2 months earlier. By
- Page 145 and 146:
Chart 8Personal Saving RatePERCENT1
- Page 147 and 148:
chief cyclical determinant of housi
- Page 149 and 150:
ment were sharply diminished by the
- Page 151 and 152:
dropped even faster, in large part
- Page 153 and 154:
ployment grew more vigorously after
- Page 155 and 156:
terials fell for a full third of th
- Page 157 and 158:
1979, slowed to a 19 percent annual
- Page 159 and 160:
costs of production. The evidence s
- Page 161 and 162:
sharp decline in output in the seco
- Page 163 and 164:
ecord high interest rates during th
- Page 165 and 166:
automatic transfer services (ATS) n
- Page 167 and 168:
plunged in March, although the only
- Page 169 and 170:
(FHLB) System increased their borro
- Page 171 and 172:
THE PROSPECTS FOR 1981 AND 1982In 1
- Page 173 and 174:
expectations. Of course, if the eco
- Page 175 and 176:
The uncertainty of developments in
- Page 177 and 178:
produce a slight decline in the sav
- Page 179 and 180:
more rapid growth thereafter. Durin
- Page 181 and 182:
eemergence of modest but sustained
- Page 183 and 184:
hike would depend on many factors,
- Page 185 and 186:
major revision of the NIPA occurred
- Page 187 and 188:
per year. This modest acceleration
- Page 189 and 190:
THE INDUSTRIAL ECONOMIES: TRENDS AN
- Page 191 and 192:
Chart 10Labor Costs, Value-Added De
- Page 193 and 194:
Rather, the German current account
- Page 195 and 196:
TABLE 30.—Inflation in major indu
- Page 197 and 198:
THE GLOBAL OIL MARKETTable 31 summa
- Page 199 and 200:
may be preserved. Stocks are in fac
- Page 201 and 202:
straint on growth. Finally, policie
- Page 203 and 204:
outside government, both at home an
- Page 205 and 206:
ates are high, differences in polic
- Page 207 and 208: Japanese trade performance in volum
- Page 209 and 210: No "Say's Law" operates in internat
- Page 211 and 212: the cost of the loans, and they may
- Page 213 and 214: At the same time, access to the IMF
- Page 215 and 216: to closer cooperation is to risk a
- Page 217 and 218: While all countries, in attempting
- Page 219: threats of disruption, market-shari
- Page 223: LETTER OF TRANSMITTALCOUNCIL OF ECO
- Page 226 and 227: Past Council Members and their date
- Page 228 and 229: 1977 to review selected analyses of
- Page 230 and 231: The Chairman and the Council Member
- Page 232 and 233: University). Kate Stith Pressman, s
- Page 235 and 236: CONTENTSNATIONAL INCOME OR EXPENDIT
- Page 237 and 238: GOVERNMENT FINANCE'—ContinuedB-72
- Page 239 and 240: NATIONAL INCOME OR EXPENDITURETABLE
- Page 241 and 242: TABLE B-2.—Gross national product
- Page 243 and 244: TABLE B-3.—Implicit price deflato
- Page 245 and 246: TABLE B-5.—Implicit price deflato
- Page 247 and 248: TABLE B-7.—Gross national product
- Page 249 and 250: TABLE B-8.—Gross national product
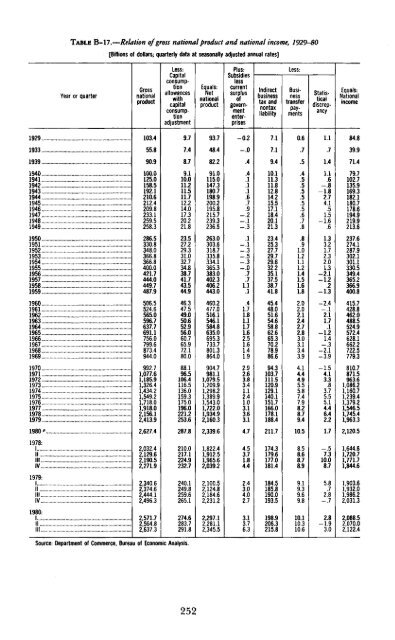
- Page 251 and 252: TABLE B-10.—Gross national produc
- Page 253 and 254: TABLE B-12.—Output, costs, and pr
- Page 255 and 256: TABLE B-14.—Gross private domesti
- Page 257: TABLE B-16.—Inventories and final
- Page 261 and 262: TABLE B-19-—National income by ty
- Page 263 and 264: Year orquarter192919331939194019411
- Page 265 and 266: TABLE B-22.—Total and per capita
- Page 267 and 268: Year orquarterTotalTotalCurrencyand
- Page 269 and 270: TABLE B-26.—Population by age gro
- Page 271 and 272: TABLE B-27.—Noninstitutional popu
- Page 273 and 274: Year or monthTABLE B-29.—Selected
- Page 275 and 276: TABLE B-31.—Unemployment rate by
- Page 277 and 278: TABLE B-33.—Unemployment by reaso
- Page 279 and 280: TABLE B-35.—Wage and salary worke
- Page 281 and 282: TABLE B-37.—Average weekly earnin
- Page 283 and 284: TABLE B-39.—Changes in productivi
- Page 286 and 287: TABLE B-42.—Industrial production
- Page 288 and 289: TABLE B-44;—New construction acti
- Page 290 and 291: TABLE B-45.—New housing units sta
- Page 292 and 293: TABLE B-47.—Sales and inventories
- Page 294 and 295: TABLE B-49.—Manufacturers' new an
- Page 296 and 297: TABLE B-51.—Consumer price indexe
- Page 298 and 299: 19391940194119421943194419451946194
- Page 300 and 301: TABLE B-54.—Changes in special co
- Page 302 and 303: TABLE B-55.—Producer price indexe
- Page 304 and 305: TABLE B-57.—Producer price indexe
- Page 306 and 307: TABLE B-58.—Changes in producer p
- Page 308 and 309:
TABLE B-60.—Components of money s
- Page 310 and 311:
TABLE B-62.— Total funds raised i
- Page 312 and 313:
TABLE B-63.—Federal Reserve Bank
- Page 314 and 315:
TABLE B-65.—Bond yields and inter
- Page 316 and 317:
TABLE B-66—Consumer credit outsta
- Page 318 and 319:
TABLE B-68.—Mortgage debt outstan
- Page 320 and 321:
GOVERNMENT FINANCETABLE B-70.—Fed
- Page 322 and 323:
TABLE B-l\.—Federal budget receip
- Page 324 and 325:
TABLE B-73.—Government receipts a
- Page 326 and 327:
TABLE B-75.—State and local gover
- Page 328 and 329:
TABLE B-77,—Interest-bearing publ
- Page 330 and 331:
TABLE B-79-—Maturity distribution
- Page 332 and 333:
TABLE B-81.—Corporate profits by
- Page 334 and 335:
TABLE B-83.—Sales, profits, and s
- Page 336 and 337:
TABLE B-85.—Relation of profits a
- Page 338 and 339:
TABLE B-87.—Sources and uses of f
- Page 340 and 341:
TABLE B-89-—State and municipal a
- Page 342 and 343:
TABLE B-91.—Business formation an
- Page 344 and 345:
TABLE B-93.—Farm output ami produ
- Page 346 and 347:
Year or month1940194119421943194419
- Page 348 and 349:
TABLE B-97.—Balance sheet of the
- Page 350 and 351:
TABLE B-99— U.S. international tr
- Page 352 and 353:
TABLE B-100.—U.S. merchandise exp
- Page 354 and 355:
TABLE B-102.—U.S. merchandise exp
- Page 356 and 357:
TABLE B-104.— World trade: Export
- Page 358 and 359:
TABLE B-106.—International reserv
- Page 360 and 361:
• • ' •TABLE B-108.—Industr
- Page 362 and 363:
TABLE B-110.—Summary of major U.S