TABLE B-49.—Manufacturers' new and unfilled orders, 1947-80[Amounts in millions <strong>of</strong> dollars; monthly data seasonally adjusted]New orders*Unfilled orders 2Unfilled orders—shipmentsratio 3Year or monthTotalTotalindustriesTotalDurablegoodsindustriesindustriesTotalDurablegoodsIndustriesCapitalgoodsindus*tries,nondefenseNondurablegood ;oodsindustiNondurableNondurablegoodsindustries1947...1948...1949.19501951..195219531954 .1955.1956..1957..1958.1959.1960.196119621963..1964..19651966.1967 .19681969197019711972,.197319741975..1976...1977.197819791979:JanFeb...Mar...fc..June.July..,Aug .SeptOct.Nov..Dec1980:JanFeb.. .Mar.May"June.July..Aug..SeptOclNov *.,15,25617,69315,61420,11023,90723,20423,58622,33527,46528,36827,55927,00230,72430,23531,10433,43635,52438,35742,10046,40247,06250,68453,96752,06855,99064,16276,18387,15785,08299,184112,451128,488144,335140,822143,138146,836139,232143,302142,386142,620143,615147,378146,610146,996149,232155,588154,603152,065143,313138,920138,582147,104147,180155,262158,054159,6296,3888,1266,63310,16512,84112,06112,14710,76814,99615,36514,11113,29016,00315,30315,75917,37418,70920,65223,27826,17725,83128,11329,88727,41830,00435,05942,85346,74041,95751,04759,56270,14577,21578,68480,43081,64975,92777,03776,02874,58574,76277,64776,52175,90377,19981,46781,02177,54672,41667,32866,45474,22872,22978,96080,69381,7567,0707,7466,8007,5178,80311,08912,73710,77212,50115,08418,30821,64321,22622,48323,60420,60021,12921,70421,22721,07721,57821,07321,75422,28523,85921,48022,59022,16219,58919,95421,60819,37120,86020,61821,9809,5668,9819,94511,06611,14311,43911,56612,46913,00313,44813,71214,72014,93215,34516,06116,81517,70518,82320,22521,23122,57124,07924,65025,98629,10433,33040,41743,12548,13752,88958,34467,12062,13862,70865,18763,30566,26466,35968,03568,85469,73170,08971,09272,03374,12173,58274,51970,89771,59272,12872,87674,95176,30277,36177,87334,47330,73624,04541,45667,26675,85761,17848,26660,00467,37553,18347,37052,73245,08047,40748,57754,32766,88280,07198,401105,030109,912115,142105,916106,772120,395159,468187,574169,126173,646193,561239,321279,710244,930252,350258,148262,981264,500267,837268,362269,269273,033274,097276,767279,710283,211284,924286,907286,629284,033281,044282,463282,997285,497286,849288,09428,57926,61919,62235,43563,39472,68058,63745,25056,24163,88050,35244,55949,37342,51444,37545,96551,27063,69176,29894,575101,058105,935110,969101,323101,744114,059152,089182,037161,286165,509184,708228,819267,879234,725241,820247,706252,433253,956257,187257,897258,295261,742262,719264,871267,879271,399273,263274,884275,098272,981270,383272,062272,231274,622275,813277,3005,8944,1174,4236,0213,8723,1772,5413,0163,7633,4952,8312,8113,3592,5663,0322,6123,0573,1913,7733,8263,9723,9774,1734,5935,0286,3367,3795,5377,8408,1378,85210,50211,83110,20510,53110,44210,54810,54410,65010,46510,97411,29111,37811,89611,83111,81211,66112,02311,53111,05210,66110,40110,76610,87511,03610,7941 Monthly average for year and total for month.2 Seasonally adjusted, end <strong>of</strong> period.3 Ratio <strong>of</strong> unfilled orders at end <strong>of</strong> period to shipments for period; excludes industries with no unfilled orders. Annual figures relateto seasonally adjusted data for December.Note.—Data beginning 1958 are not strictly comparable with earlier data.Source: Department <strong>of</strong> Commerce, Bureau <strong>of</strong> <strong>the</strong> Census.3.423.633.873.353.093.012.782.632.692.803.103.333.813.713.843.743.643.373.293.874.123.693.203.163.353.673.433.513.443.693.523.643.573.583.633.573.663.673.533.533.623.753.833.823.713.763.563.513.494.124.274.554.003.693.543.373.133.243.373.723.954.554.424.644.484,384.043.894.584.944.423.833.773.924.354.054.134.044.394.184.324.264.244.314.234.354.354.204.174.304.504.614.604.484.524.264.184.150.961.121.04.85.86,94.72,79.68.73.72.80.76.73.69.69.77.77.88.93.64.83.74.73.80.81.76.79.75.77.74.75.71.76.78.78.81.81.75.77.79.76.74.71.68.72.69.71.69288
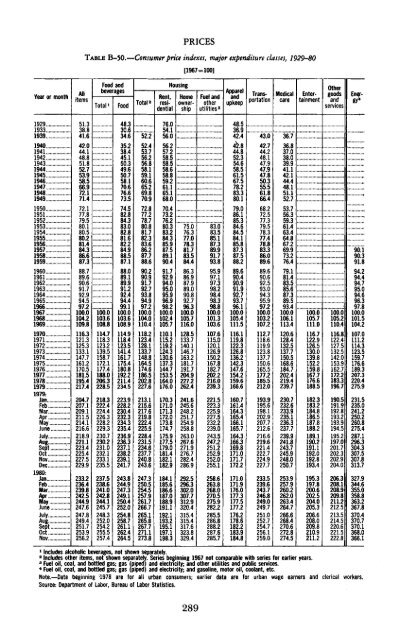
PRICESTABLE B-50.—Consumer price indexes, major expenditure classes, 1929-80[1967 = 100]Year or monthAllitemsFood andbeveragesTotal >FoodTotal 2Rent,residentialHousingFuel ando<strong>the</strong>rutilities 3ApparelandupkeepMedicalcareO<strong>the</strong>rgoodsandservicesHomeownershipTransportationEntertainmentEnergy1 *1929 ..19331939. . . .1940 . .1941 .. ..19421943.194419451946.194719481949. .195019511952.. ..19531954. . ..19551956 . .. .1957195819591960196]19621963196419651966 . .19671968196919701971 . .1972 .1973... „1974 .19751976197719781979.1979:Jan.FebMar. ..AprMay .JuneJulyAug.SeptOct.. ..NovDec1980.Jan. .FebMar . . .Xv JuneJuly . ...AugSeptOctNov51.338.841.642.044.148.851.852.753958.566 972.171.472.177.879.580.180.580.281.484 386.687.388.789.690.691.792.994 597.2100.0104 2109.8116.3121.3125.3133.1147.7161.2170.51815195.4217.4204.7207.1209.1211.5214.1216.6218.9221.1223.4225.4227 5229.9233.2236.4239.8242.5244.9247.6247.8249.4251.7253.9256.2..."""'.103 6108.8114.7118.3123.2139.5158.7172.1177.4188.0206.3228.5218.3222.4224.4226.3228.2229.3230.7230.2231.0232.12331235.5237.5238.6241.0242.8244.1245.7248.3252.0254.2255.5257.448.330 634.635.238.445.150.349.650.758.170.676.673.574.582.884.383.082.881.682.284.988.587.188.089.189.991.292.494 499.1100.0103.6108.9114.9118.4123.5141.4161.7175.4180.8192.2211.4234.5223.9228.2230.4232.3234.3235.4236.9236.3237.1238.2239.1241.7243.8244.9247.3249.1250.4252.0254.8258.7261.1262.4264.552Y52.453.756.256.858.159160.665.269.870.972.877.278.780.881.782.383.686.287.788.690.290.991.792.793.894 997.2100.0104 0110.4118.2123.4128.1133.7148.8164.5174.6186 5202.8227.6213.1215.6217.6219.8222.4225.5228.4231.5234.6237.7240 8243.6247.3250.5254.5257.9261.7266.7265.1265.8267.7271.1273.876.054156056.257.258.558.558.658.859.261.165.168.070.473.276.280.383.284.385.987.589.190.491.792.994.095.095.996 998.2100.0102.4105.7110.1115.2119.2124.3130.6137.3144.7153.5164.0176.0170.3171.0171.3172.0173.8174.7175.9177.5179.0181.41821182.9184.1185.6186.6187.0188.9191.1192.1193.2195.1197.1198.375.076.377.078.381783.584.486.386.987.989.090.892 796.3100.0105.7116.0128.5133.7140.1146.7163.2181.7191.7204 9227.2262.4241.6245.6248.2251.7254.9258.8263.0267.6271.9276.7282 4286.9292.5296.3302.0307.7312.9320.4315.4315.4317.6323.8329.483.083.585.187.389.991.793.895.997.197.398.298.498398.8100.0101.3103.6107.6115.0120.1126.9150.2167.8182.7202 2216.0239.3221.5223.3225.9227.5232.2239.0243.5247.2251.2252.9252 0255.1258.6263.8268.0270.5275.9282.2285.5286.8288.2287.6285.748.536942.44^.844.852.354.658.561.567.578.283.380.179.086.185.384.684.584.185.887.387.588.289.690.490.991.992.793 796.1100.0105.4111.5116.1119.8122.3126.8136.2142.3147.6154.2159.6166.6160.7161.4164.3165.4166.1165.7164.3166.3169.8171.0171.7172.2171.0171.9176.0177.3177.5177.2176.2178.6182.2183.9184.843.042.744.248.147.947.947 850.355 561.866.468 272.577.379.578.377.478.883.386.089.689.690.692.593.094.395 997.2100.0103.2107.2112.7118.6119.9123.8137.7150.6165.5177 2185.5212.0193.9195.6198.1202.9207.7212.6216.6219.6221.4222.7224 9227.7233.5239.6243.7246.8249.0249.7251.0252.7254.7256.1259.036.736.837.038.039 941142144.448151.152.753.756.359.361.463.464 867 269.973.276.479.181.483.585.687.389 593.4100.0106.1113.4120.6128.4132.5137.7150.5168.6184.7202 4219.4239.7230.7232.6233.9235.1236.3237.7239.9241.8243.7245.9248.0250.7253.9257.9260.2262.0263.4264.7266.6268.4270.6272.8274.5ib'6"6"105.7111.0116.7122.9126.5130.0139.8152.2159.8167.7176.6188.5182.3183.2184.8186.5187.8188.2189.1190.2191.1192.0192.8193.4195.3197.8200.6202.5204.0205.3206.6208.0209.8210.9211.2ioo.o105.2110.4116.8122.4127.5132.5142.0153.9162.7172.2183.3196.7190.5191.9192.8193.2193.9194.5195.2197.0201.7202.3202.9204.0206.3208.1208.9209.8211.2212.5213.5214.5220.6221.5222.8190.190.391.894.294.494.795 094.6963978100.0101.5104.2107.0111.2114.3123.5159.7176.6189.3207.3220.4275.9231.5235.0241.2250.2260.8275.4287.1296.3304.3307.5307.8313.7327.9344.6355.0358.8363.2367.8370.4370.7370.1368.0366.11 Includes alcoholic beverages, not shown separately.2 Includes o<strong>the</strong>r items, not shown separately. Series beginning 1967 not comparable with series for earlier years.3 Fuel oil, coal, and bottled gas; gas (piped) and electricity; and o<strong>the</strong>r utilities and public services.4 Fuel oil, coal, and bottled gas; gas (piped) and electricity; and gasoline, motor oil, coolant, etc.Note.—Data beginning 1978 are for all urban consumers; earlier data are for urban wage earners and clerical workers.Source: Department <strong>of</strong> Labor, Bureau <strong>of</strong> Labor Statistics.289
- Page 3:
Economic Reportof the PresidentTran
- Page 7:
ECONOMIC REPORTOF THE PRESIDENT
- Page 10 and 11:
We have heard much about American i
- Page 12 and 13:
at an approach that took account of
- Page 14 and 15:
een due to overall demand in the ec
- Page 16 and 17:
to $27.5 billion in the new budget
- Page 18 and 19:
ductions would amount to over $27 b
- Page 20 and 21:
10 percent inflation rate, keeping
- Page 22 and 23:
tutes for petroleum. The Synthetic
- Page 24 and 25:
esponse can be so large as to wipe
- Page 27:
THE ANNUAL REPORTOF THECOUNCIL OF E
- Page 31 and 32:
CONTENTSCHAPTER 1. INFLATION AND GR
- Page 33 and 34:
PageChallenges to the International
- Page 35 and 36:
CHAPTER 1Inflation and Growth in th
- Page 37 and 38:
needed to control inflation by resi
- Page 39 and 40:
decline in productivity growth may
- Page 41 and 42:
Chart 1Standard Unit Labor CostsPER
- Page 43 and 44:
end of 1974 the world price of oil
- Page 45 and 46:
price decisions cannot easily be re
- Page 47 and 48:
Federal budget achieved a surplus.
- Page 49 and 50:
As an abrupt increase in the price
- Page 51 and 52:
policies but are based on the wides
- Page 53 and 54:
tion, and can policies be designed
- Page 55 and 56:
duction and employment to grow only
- Page 57 and 58:
Moreover, their actions must indica
- Page 59 and 60:
Starting with its 1975 targets as a
- Page 61 and 62:
well after the fact whether the mon
- Page 63 and 64:
Reserve provides some flexibility i
- Page 65 and 66:
in response to circumstances in par
- Page 67 and 68:
Although the flexibility of TIPs ma
- Page 69 and 70:
ard or that thought the administrat
- Page 71 and 72:
given standard, as the reward and t
- Page 73 and 74:
large firms. Even among large firms
- Page 75 and 76:
cause declining productivity growth
- Page 77 and 78:
vanced technology and will therefor
- Page 79 and 80:
ather than restoring the growth of
- Page 81 and 82:
correct some of the distortions in
- Page 83 and 84:
higher than it would otherwise be b
- Page 85 and 86:
EXPECTED PRODUCTIVITY GAINSAlthough
- Page 87 and 88:
supply of adult men in the work for
- Page 89 and 90:
increase demand pressures, especial
- Page 91 and 92:
time hours also has drawbacks. For
- Page 93 and 94:
eintroduce the problem of changing
- Page 95 and 96:
CHAPTER 2Improving the Adaptability
- Page 97 and 98:
use less and produce more energy in
- Page 99 and 100:
expectation of price controls or fu
- Page 101 and 102:
dependence on foreign oil mean that
- Page 103 and 104:
While the market solution might pro
- Page 105 and 106:
High energy prices and excessive de
- Page 107 and 108:
part, the interests of these partie
- Page 109 and 110:
Federal regulations designed to pro
- Page 111 and 112:
Agency (EPA) from considering prosp
- Page 113 and 114:
other things, that federally assist
- Page 115 and 116:
ing services. Money-market mutual f
- Page 117 and 118:
holdings of consumer and business l
- Page 119 and 120:
they once had and thus cannot conti
- Page 121 and 122:
finding ways around outdated regula
- Page 123 and 124:
proportion of the existing farms pr
- Page 125 and 126:
prices for years in the future, reg
- Page 127 and 128:
derground water resources once thou
- Page 129 and 130:
comprehensive, actuarial crop insur
- Page 131 and 132:
duced a decline in the median age o
- Page 133 and 134:
elude government investments in loc
- Page 135 and 136:
some of the firms in the chosen sec
- Page 137 and 138:
CHAPTER 3The Economy: Review and Pr
- Page 139 and 140:
uild up oil inventories and maintai
- Page 141 and 142:
Chart 7Selected Interest Ratesand B
- Page 143 and 144:
had risen just 2 months earlier. By
- Page 145 and 146:
Chart 8Personal Saving RatePERCENT1
- Page 147 and 148:
chief cyclical determinant of housi
- Page 149 and 150:
ment were sharply diminished by the
- Page 151 and 152:
dropped even faster, in large part
- Page 153 and 154:
ployment grew more vigorously after
- Page 155 and 156:
terials fell for a full third of th
- Page 157 and 158:
1979, slowed to a 19 percent annual
- Page 159 and 160:
costs of production. The evidence s
- Page 161 and 162:
sharp decline in output in the seco
- Page 163 and 164:
ecord high interest rates during th
- Page 165 and 166:
automatic transfer services (ATS) n
- Page 167 and 168:
plunged in March, although the only
- Page 169 and 170:
(FHLB) System increased their borro
- Page 171 and 172:
THE PROSPECTS FOR 1981 AND 1982In 1
- Page 173 and 174:
expectations. Of course, if the eco
- Page 175 and 176:
The uncertainty of developments in
- Page 177 and 178:
produce a slight decline in the sav
- Page 179 and 180:
more rapid growth thereafter. Durin
- Page 181 and 182:
eemergence of modest but sustained
- Page 183 and 184:
hike would depend on many factors,
- Page 185 and 186:
major revision of the NIPA occurred
- Page 187 and 188:
per year. This modest acceleration
- Page 189 and 190:
THE INDUSTRIAL ECONOMIES: TRENDS AN
- Page 191 and 192:
Chart 10Labor Costs, Value-Added De
- Page 193 and 194:
Rather, the German current account
- Page 195 and 196:
TABLE 30.—Inflation in major indu
- Page 197 and 198:
THE GLOBAL OIL MARKETTable 31 summa
- Page 199 and 200:
may be preserved. Stocks are in fac
- Page 201 and 202:
straint on growth. Finally, policie
- Page 203 and 204:
outside government, both at home an
- Page 205 and 206:
ates are high, differences in polic
- Page 207 and 208:
Japanese trade performance in volum
- Page 209 and 210:
No "Say's Law" operates in internat
- Page 211 and 212:
the cost of the loans, and they may
- Page 213 and 214:
At the same time, access to the IMF
- Page 215 and 216:
to closer cooperation is to risk a
- Page 217 and 218:
While all countries, in attempting
- Page 219:
threats of disruption, market-shari
- Page 223:
LETTER OF TRANSMITTALCOUNCIL OF ECO
- Page 226 and 227:
Past Council Members and their date
- Page 228 and 229:
1977 to review selected analyses of
- Page 230 and 231:
The Chairman and the Council Member
- Page 232 and 233:
University). Kate Stith Pressman, s
- Page 235 and 236:
CONTENTSNATIONAL INCOME OR EXPENDIT
- Page 237 and 238:
GOVERNMENT FINANCE'—ContinuedB-72
- Page 239 and 240:
NATIONAL INCOME OR EXPENDITURETABLE
- Page 241 and 242:
TABLE B-2.—Gross national product
- Page 243 and 244: TABLE B-3.—Implicit price deflato
- Page 245 and 246: TABLE B-5.—Implicit price deflato
- Page 247 and 248: TABLE B-7.—Gross national product
- Page 249 and 250: TABLE B-8.—Gross national product
- Page 251 and 252: TABLE B-10.—Gross national produc
- Page 253 and 254: TABLE B-12.—Output, costs, and pr
- Page 255 and 256: TABLE B-14.—Gross private domesti
- Page 257 and 258: TABLE B-16.—Inventories and final
- Page 259 and 260: TABLE B-18.—Relation of national
- Page 261 and 262: TABLE B-19-—National income by ty
- Page 263 and 264: Year orquarter192919331939194019411
- Page 265 and 266: TABLE B-22.—Total and per capita
- Page 267 and 268: Year orquarterTotalTotalCurrencyand
- Page 269 and 270: TABLE B-26.—Population by age gro
- Page 271 and 272: TABLE B-27.—Noninstitutional popu
- Page 273 and 274: Year or monthTABLE B-29.—Selected
- Page 275 and 276: TABLE B-31.—Unemployment rate by
- Page 277 and 278: TABLE B-33.—Unemployment by reaso
- Page 279 and 280: TABLE B-35.—Wage and salary worke
- Page 281 and 282: TABLE B-37.—Average weekly earnin
- Page 283 and 284: TABLE B-39.—Changes in productivi
- Page 286 and 287: TABLE B-42.—Industrial production
- Page 288 and 289: TABLE B-44;—New construction acti
- Page 290 and 291: TABLE B-45.—New housing units sta
- Page 292 and 293: TABLE B-47.—Sales and inventories
- Page 296 and 297: TABLE B-51.—Consumer price indexe
- Page 298 and 299: 19391940194119421943194419451946194
- Page 300 and 301: TABLE B-54.—Changes in special co
- Page 302 and 303: TABLE B-55.—Producer price indexe
- Page 304 and 305: TABLE B-57.—Producer price indexe
- Page 306 and 307: TABLE B-58.—Changes in producer p
- Page 308 and 309: TABLE B-60.—Components of money s
- Page 310 and 311: TABLE B-62.— Total funds raised i
- Page 312 and 313: TABLE B-63.—Federal Reserve Bank
- Page 314 and 315: TABLE B-65.—Bond yields and inter
- Page 316 and 317: TABLE B-66—Consumer credit outsta
- Page 318 and 319: TABLE B-68.—Mortgage debt outstan
- Page 320 and 321: GOVERNMENT FINANCETABLE B-70.—Fed
- Page 322 and 323: TABLE B-l\.—Federal budget receip
- Page 324 and 325: TABLE B-73.—Government receipts a
- Page 326 and 327: TABLE B-75.—State and local gover
- Page 328 and 329: TABLE B-77,—Interest-bearing publ
- Page 330 and 331: TABLE B-79-—Maturity distribution
- Page 332 and 333: TABLE B-81.—Corporate profits by
- Page 334 and 335: TABLE B-83.—Sales, profits, and s
- Page 336 and 337: TABLE B-85.—Relation of profits a
- Page 338 and 339: TABLE B-87.—Sources and uses of f
- Page 340 and 341: TABLE B-89-—State and municipal a
- Page 342 and 343: TABLE B-91.—Business formation an
- Page 344 and 345:
TABLE B-93.—Farm output ami produ
- Page 346 and 347:
Year or month1940194119421943194419
- Page 348 and 349:
TABLE B-97.—Balance sheet of the
- Page 350 and 351:
TABLE B-99— U.S. international tr
- Page 352 and 353:
TABLE B-100.—U.S. merchandise exp
- Page 354 and 355:
TABLE B-102.—U.S. merchandise exp
- Page 356 and 357:
TABLE B-104.— World trade: Export
- Page 358 and 359:
TABLE B-106.—International reserv
- Page 360 and 361:
• • ' •TABLE B-108.—Industr
- Page 362 and 363:
TABLE B-110.—Summary of major U.S