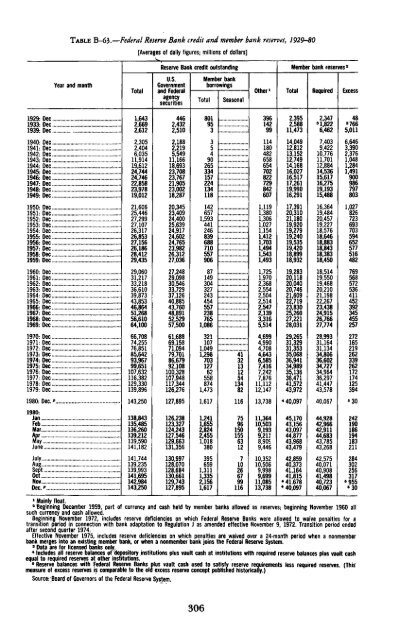
TABLE B-63.—Federal Reserve Bank credit and member bank reserves, 1929-80[Averages <strong>of</strong> daily figures; millions <strong>of</strong> dollars]Year and monthTotalReserve Bank credit outstandingU.S.Governmentand FederalagencysecuritiesMember bankborrowingsTotalSeasonalO<strong>the</strong>r l Member bank reserves 2Total Required Excess1929: Dec...1933: Dec...1939: Dec .1940: Dec.1941: Dec .1942: Dec1943: Dec .1944-. Dec..1945: Dec .1946: Dec .1947: Dec1948: Dec.1949: Dec .1950: Dec.1951: Dec.1952: Dec.1953: Dec .1954: Dec1955: Dec1956: Dec1957: Dec.1958: Dec.1959: Dec1960: Dec .1961: Dec.1962: Dec..1963: Dec1964: Dec...1965: Dec...1966: Dec...1967: Dec...1968: Dec...1969: Dec...,1970: Dec...1971: Dec..,1972: Dec...1973: Dec...,1974: Dec..,1975: Dec....1976: Dec.1977: Dec..,1978: Dec..,1979: Dec...1980: Dec. r.1980:JanFebMarMay*.' .,JuneJulyAug....SeptOct. .NovDec."1,6432,6692,6122,3052,4046,03511,91419,61224,74424,74622,85823,97819,01221,60625,44627,29927,10726,31726,85327,15626,18628,41229,43529,06031,21733,21836,61039,87343,85346,86451,26856,61064,10066,70874,25576,85185,64293,96799,651107,632116,382129,330139,896143,250138,843135,485136,260139,212139,590141,182141,744139,235139,993141,695142,984143,2504462,4322,5102,1882,2195,54911,16618,69323,70823,76721,90523,00218,28720,34523,40924,40025,63924,91724,60224,76523,98226,31227,03627,24829,09830,54633,72937,12640,88543,76048,89152,52957,50061,68869,15871,09479,70186,67992,108100,328107,948117,344126,276127,895126,238123,327124,243127,546129,663131,356130,997128,070128,684130,661129,743127,895801953354902653341572241341181426571,593441246839688710557906871493043272434545572387651,0863211071,0491,298703127625588741,4731,6171,2411,6552,8242,4551,0183803956591,3111,3352,1561,61741321312541348211675961501556312710266799116396142991141804826586547028227298426071,1191,3801,3061,0271,1541,4121,7031,4941,5431,4931,7251,9702,3682,5542,5042,5142,5472,1393,3165,5144,6994,9904,7084,6436,5857,4167,2427,87611,11212,14713,73811,36410,5039,1939,2118,90
TABLE B-64.—Aggregate reserves and member bank deposits, 1959-80[Averages <strong>of</strong> daily figures; billions <strong>of</strong> dollars, seasonally adjusted]Year and monthReserves <strong>of</strong> depositoryinstitutions 1Total 2NonborrowedRequiredMonetarybase 3Member bank deposits subject toreserve requirementsTotalTimeandsavingsPrivateAdjusted for changes in reserverequirements 4TotalsitoryinstitutionsU.S.GovernmentNonborrowedRequiredMonetarybase1959: Dec18.6117.6718.1048.3157.854.498.64.816.1215.1815.6145.8I960: Dec1961: Dec1962: Dec .1963: Dec.1964: Dec18.9119.7619.7220.3921.2718.8419.6319.4620.0621.0118.1719.1819.1419.9020.8748.750.251.253.856.5162.2175.4189.1203.7219.158.967.880.192.4104.198.8102.7103.3105.9109.14.64.95.75.45.916.3516.9117.3617.8518.5016.2716.7717.1017.5218.2415.6016.3216.7917.3618.1046.147.348.851.353.81965: Dec1966: Dec1967: Dec1968: Dec1969: Dec22.3423.3924.9127.1828.0721.9022.8624.6926.4326.9521.9223.0524.5426.7527.7859.862.966.572.075.6238.9246.8276.3300.4288.0121.1129.0149.3164.9150.7113.0114.1121.5130.6132.14.83.75.44.95.219.3019.4121.2022.5322.4318.8618.8820.9721.7821.3118.8819.0720.8222.1022.1456.758.962.867.369.91970: Dec1971: Dec1972: Dec1973: Dec1974- Dec29.2231.2831.4034.9836.6628.8931.1530.3533.6835.9428.9731.0931.1134.6836.4179.885.590.298.6106.8321.7361.1402.8443.4487.2179.4211.4242.4280.4323.3136.1143.8154.4158.2160.66.25.86.14.83.323.9825.6328.5330.2532.1523.6525.5027.4828.9531.4223.7325.4428.2529.94318974,679.987.393.910211975: Dec.1976: Dec1977: Dec1978: Dec .1979: Dec34.6734.9036.0041.1643.5734.5434.8535.4340.2942.1034.4034.6335.8140.9343.13111.0118.4127.6142.2153.8504.9528.3567.6616.1644.4337.5353.6385.6428.7451.1164.6171.7178.5185.1191.52.83.03.52.21.832.1732.6734.1036.0337.5132.0432.6233.5335.1636.0331.9032.3933.9135.8037.06107.6115.2124.8136.1146.81980: Dec. P40.1338.4439.58159.8701.8503.9195.91.940.1138.4239.56159.71979:JanFebMarp..-:::June413640.87407540.7040.6740.5340 3639,9039 7639.7838.9039.11411540.6640 5940.5240.5340.31143 2143.4143 9144.6145.1145.9619 0617.5615 4618.7616.0614.7431.2432.9432.3431.8429.8427.6185 8182.71812185.0184.2185.0201.9181.91.92.1361935.7135 6035.5735.5935.56351934.7434 6134.6533.8334.1435 9835.51354435.4035.4535.34137 1137.3137 9138.5139.2140.1JulyAueSeptOctNovDec40:7841.1141.4342.2043.0643.5739.6140.0340.0940.1841.1542.1040.5740.8941.2441.9342.8143.13147.1148.6150.0151.5152.8153.8619.3625.4631.5638.2641.9644.4430.6436.3441.7446.6450.1451.1186.9187.0188.1189.8190.0191.51.82.11.71.71.91.835.8036.0536.2936.8236.9437.5134.6334.9634.9534.8035.0336.0335.5935.8336.1036.5536.6937.06141.2142.6144.0145.2145.8146.81980:JanFeb...MarAprMayJuneJutvAugSeptOctNovDec "43.4443.3543.6744.8544.4543.9642.7840.7541.5241.7341.2340.1342.2041.7040.8542.3943.4343.5842.3940.0940.2140.4239.1738.4443.1943.1443.4844.6544.2743.7642.5040.4541.2641.5240.7339.58154.7155.6156.6157.9158.5158.9158.8158.2159.5160.9160.6159.8643.7647.2649.1655.4656.8658.0658.5667.8678.2684.7694.5701.8451.9454.4457.9464.2467.7467.9467.0474.2482.0486.7494.2503.9189.5190.9189.4188.7187.3188.4189.1191.5194.5195.6198.2195.92.31.91.82.41.81.72.52.11.82.42.21.937.4837.4037.4837.5237.4937.4637.5738.0538.7338.89M0.0640.1136.2335.7534.6535.0636.4737.0837.1837.3937.4137.585 38.0038.4237.2237.1937.2937.3237.3137.2637.2937.7538.4738.695 39.5639.56147.8148.7149.5149.7150.7151.5152.6154.6155.8157.15 159.1159.71 Reserves <strong>of</strong> depository institutions series reflect actual reserve requirement percentages with no adjustment to eliminate <strong>the</strong> effect<strong>of</strong> changes in Regulations D and M. Prior to November 13, 1980, <strong>the</strong> date <strong>of</strong> implementation <strong>of</strong> <strong>the</strong> Monetary Control Act, only <strong>the</strong>reserves <strong>of</strong> commercial banks that were members <strong>of</strong> <strong>the</strong> Federal Reserve System were included in <strong>the</strong> series. Since that date <strong>the</strong> seriesinclude <strong>the</strong> reserves <strong>of</strong> all depository institutions. In conjunction with <strong>the</strong> implementation <strong>of</strong> <strong>the</strong> act, required reserves <strong>of</strong> memberbanks were reduced about $4.3 billion and required reserves <strong>of</strong> o<strong>the</strong>r depository institutions were increased about $1.4 billion. EffectiveOctober 11, 1979, an 8 percentage point marginal reserve requirement was imposed on "managed liabilities". This action raisedrequired reserves about $320 million. Effective March 12, 1980, <strong>the</strong> 8 percentage point marginal reserve requirement was raised to 10percentage points. In addition <strong>the</strong> base upon which <strong>the</strong> marginal reserve requirement was calculated was reduced. This action increasedrequired reserves about $1.7 billion in <strong>the</strong> week ending April 2, 1980. Effective May 29, 1980, <strong>the</strong> marginal reserve requirement wasreduced from 10 to 5 percentage points and <strong>the</strong> base upon which <strong>the</strong> marginal reserve requirement was calculated was raised. Thisaction reduced required reserves about $980 million in <strong>the</strong> week ending June 18, 1980. Effective July 24, 1980, <strong>the</strong> 5 percent marginalreserve requirement on managed liabilities and <strong>the</strong> 2 percent supplementary reserve requirement against large time deposits wereremoved. These actions reduced required reserves about $3.2 billion.2 Reserve balances with Federal Reserve Banks plus vault cash at institutions with required reserve balances plus vault cash equal torequired reserves at o<strong>the</strong>r institutions.3 Includes reserve balances at Federal Reserve Banks in <strong>the</strong> current week plus vault cash held two weeks earlier used to satisfyreserve requirements at all depository institutions plus currency outside <strong>the</strong> U.S. Treasury, Federal Reserve Banks, <strong>the</strong> vaults <strong>of</strong>depository institutions, and surplus vault cash at depository institutions.4 Reserve aggregates series have been adjusted to remove discontinuities associated with <strong>the</strong> implementation <strong>of</strong> <strong>the</strong> Monetary ControlAct, marginal reserve requirements, <strong>the</strong> inclusions <strong>of</strong> Edge Act Corporation reserves, and o<strong>the</strong>r changes in Regulations D, K, and M.5 Reserve measures beginning November reflect increases in required reserves associated with <strong>the</strong> reduction <strong>of</strong> weekend avoidanceactivities <strong>of</strong> a few large banks. The reduction in <strong>the</strong>se activities leads to essentially a one-time increase in <strong>the</strong> average level <strong>of</strong> requiredreserves that need to be held for a given level <strong>of</strong> deposits entering <strong>the</strong> money supply. In November, this increase in required reserves isestimated at $550 to $600 million.Source: Board <strong>of</strong> Governors <strong>of</strong> <strong>the</strong> Federal Reserve System.307
- Page 3:
Economic Reportof the PresidentTran
- Page 7:
ECONOMIC REPORTOF THE PRESIDENT
- Page 10 and 11:
We have heard much about American i
- Page 12 and 13:
at an approach that took account of
- Page 14 and 15:
een due to overall demand in the ec
- Page 16 and 17:
to $27.5 billion in the new budget
- Page 18 and 19:
ductions would amount to over $27 b
- Page 20 and 21:
10 percent inflation rate, keeping
- Page 22 and 23:
tutes for petroleum. The Synthetic
- Page 24 and 25:
esponse can be so large as to wipe
- Page 27:
THE ANNUAL REPORTOF THECOUNCIL OF E
- Page 31 and 32:
CONTENTSCHAPTER 1. INFLATION AND GR
- Page 33 and 34:
PageChallenges to the International
- Page 35 and 36:
CHAPTER 1Inflation and Growth in th
- Page 37 and 38:
needed to control inflation by resi
- Page 39 and 40:
decline in productivity growth may
- Page 41 and 42:
Chart 1Standard Unit Labor CostsPER
- Page 43 and 44:
end of 1974 the world price of oil
- Page 45 and 46:
price decisions cannot easily be re
- Page 47 and 48:
Federal budget achieved a surplus.
- Page 49 and 50:
As an abrupt increase in the price
- Page 51 and 52:
policies but are based on the wides
- Page 53 and 54:
tion, and can policies be designed
- Page 55 and 56:
duction and employment to grow only
- Page 57 and 58:
Moreover, their actions must indica
- Page 59 and 60:
Starting with its 1975 targets as a
- Page 61 and 62:
well after the fact whether the mon
- Page 63 and 64:
Reserve provides some flexibility i
- Page 65 and 66:
in response to circumstances in par
- Page 67 and 68:
Although the flexibility of TIPs ma
- Page 69 and 70:
ard or that thought the administrat
- Page 71 and 72:
given standard, as the reward and t
- Page 73 and 74:
large firms. Even among large firms
- Page 75 and 76:
cause declining productivity growth
- Page 77 and 78:
vanced technology and will therefor
- Page 79 and 80:
ather than restoring the growth of
- Page 81 and 82:
correct some of the distortions in
- Page 83 and 84:
higher than it would otherwise be b
- Page 85 and 86:
EXPECTED PRODUCTIVITY GAINSAlthough
- Page 87 and 88:
supply of adult men in the work for
- Page 89 and 90:
increase demand pressures, especial
- Page 91 and 92:
time hours also has drawbacks. For
- Page 93 and 94:
eintroduce the problem of changing
- Page 95 and 96:
CHAPTER 2Improving the Adaptability
- Page 97 and 98:
use less and produce more energy in
- Page 99 and 100:
expectation of price controls or fu
- Page 101 and 102:
dependence on foreign oil mean that
- Page 103 and 104:
While the market solution might pro
- Page 105 and 106:
High energy prices and excessive de
- Page 107 and 108:
part, the interests of these partie
- Page 109 and 110:
Federal regulations designed to pro
- Page 111 and 112:
Agency (EPA) from considering prosp
- Page 113 and 114:
other things, that federally assist
- Page 115 and 116:
ing services. Money-market mutual f
- Page 117 and 118:
holdings of consumer and business l
- Page 119 and 120:
they once had and thus cannot conti
- Page 121 and 122:
finding ways around outdated regula
- Page 123 and 124:
proportion of the existing farms pr
- Page 125 and 126:
prices for years in the future, reg
- Page 127 and 128:
derground water resources once thou
- Page 129 and 130:
comprehensive, actuarial crop insur
- Page 131 and 132:
duced a decline in the median age o
- Page 133 and 134:
elude government investments in loc
- Page 135 and 136:
some of the firms in the chosen sec
- Page 137 and 138:
CHAPTER 3The Economy: Review and Pr
- Page 139 and 140:
uild up oil inventories and maintai
- Page 141 and 142:
Chart 7Selected Interest Ratesand B
- Page 143 and 144:
had risen just 2 months earlier. By
- Page 145 and 146:
Chart 8Personal Saving RatePERCENT1
- Page 147 and 148:
chief cyclical determinant of housi
- Page 149 and 150:
ment were sharply diminished by the
- Page 151 and 152:
dropped even faster, in large part
- Page 153 and 154:
ployment grew more vigorously after
- Page 155 and 156:
terials fell for a full third of th
- Page 157 and 158:
1979, slowed to a 19 percent annual
- Page 159 and 160:
costs of production. The evidence s
- Page 161 and 162:
sharp decline in output in the seco
- Page 163 and 164:
ecord high interest rates during th
- Page 165 and 166:
automatic transfer services (ATS) n
- Page 167 and 168:
plunged in March, although the only
- Page 169 and 170:
(FHLB) System increased their borro
- Page 171 and 172:
THE PROSPECTS FOR 1981 AND 1982In 1
- Page 173 and 174:
expectations. Of course, if the eco
- Page 175 and 176:
The uncertainty of developments in
- Page 177 and 178:
produce a slight decline in the sav
- Page 179 and 180:
more rapid growth thereafter. Durin
- Page 181 and 182:
eemergence of modest but sustained
- Page 183 and 184:
hike would depend on many factors,
- Page 185 and 186:
major revision of the NIPA occurred
- Page 187 and 188:
per year. This modest acceleration
- Page 189 and 190:
THE INDUSTRIAL ECONOMIES: TRENDS AN
- Page 191 and 192:
Chart 10Labor Costs, Value-Added De
- Page 193 and 194:
Rather, the German current account
- Page 195 and 196:
TABLE 30.—Inflation in major indu
- Page 197 and 198:
THE GLOBAL OIL MARKETTable 31 summa
- Page 199 and 200:
may be preserved. Stocks are in fac
- Page 201 and 202:
straint on growth. Finally, policie
- Page 203 and 204:
outside government, both at home an
- Page 205 and 206:
ates are high, differences in polic
- Page 207 and 208:
Japanese trade performance in volum
- Page 209 and 210:
No "Say's Law" operates in internat
- Page 211 and 212:
the cost of the loans, and they may
- Page 213 and 214:
At the same time, access to the IMF
- Page 215 and 216:
to closer cooperation is to risk a
- Page 217 and 218:
While all countries, in attempting
- Page 219:
threats of disruption, market-shari
- Page 223:
LETTER OF TRANSMITTALCOUNCIL OF ECO
- Page 226 and 227:
Past Council Members and their date
- Page 228 and 229:
1977 to review selected analyses of
- Page 230 and 231:
The Chairman and the Council Member
- Page 232 and 233:
University). Kate Stith Pressman, s
- Page 235 and 236:
CONTENTSNATIONAL INCOME OR EXPENDIT
- Page 237 and 238:
GOVERNMENT FINANCE'—ContinuedB-72
- Page 239 and 240:
NATIONAL INCOME OR EXPENDITURETABLE
- Page 241 and 242:
TABLE B-2.—Gross national product
- Page 243 and 244:
TABLE B-3.—Implicit price deflato
- Page 245 and 246:
TABLE B-5.—Implicit price deflato
- Page 247 and 248:
TABLE B-7.—Gross national product
- Page 249 and 250:
TABLE B-8.—Gross national product
- Page 251 and 252:
TABLE B-10.—Gross national produc
- Page 253 and 254:
TABLE B-12.—Output, costs, and pr
- Page 255 and 256:
TABLE B-14.—Gross private domesti
- Page 257 and 258:
TABLE B-16.—Inventories and final
- Page 259 and 260:
TABLE B-18.—Relation of national
- Page 261 and 262: TABLE B-19-—National income by ty
- Page 263 and 264: Year orquarter192919331939194019411
- Page 265 and 266: TABLE B-22.—Total and per capita
- Page 267 and 268: Year orquarterTotalTotalCurrencyand
- Page 269 and 270: TABLE B-26.—Population by age gro
- Page 271 and 272: TABLE B-27.—Noninstitutional popu
- Page 273 and 274: Year or monthTABLE B-29.—Selected
- Page 275 and 276: TABLE B-31.—Unemployment rate by
- Page 277 and 278: TABLE B-33.—Unemployment by reaso
- Page 279 and 280: TABLE B-35.—Wage and salary worke
- Page 281 and 282: TABLE B-37.—Average weekly earnin
- Page 283 and 284: TABLE B-39.—Changes in productivi
- Page 286 and 287: TABLE B-42.—Industrial production
- Page 288 and 289: TABLE B-44;—New construction acti
- Page 290 and 291: TABLE B-45.—New housing units sta
- Page 292 and 293: TABLE B-47.—Sales and inventories
- Page 294 and 295: TABLE B-49.—Manufacturers' new an
- Page 296 and 297: TABLE B-51.—Consumer price indexe
- Page 298 and 299: 19391940194119421943194419451946194
- Page 300 and 301: TABLE B-54.—Changes in special co
- Page 302 and 303: TABLE B-55.—Producer price indexe
- Page 304 and 305: TABLE B-57.—Producer price indexe
- Page 306 and 307: TABLE B-58.—Changes in producer p
- Page 308 and 309: TABLE B-60.—Components of money s
- Page 310 and 311: TABLE B-62.— Total funds raised i
- Page 314 and 315: TABLE B-65.—Bond yields and inter
- Page 316 and 317: TABLE B-66—Consumer credit outsta
- Page 318 and 319: TABLE B-68.—Mortgage debt outstan
- Page 320 and 321: GOVERNMENT FINANCETABLE B-70.—Fed
- Page 322 and 323: TABLE B-l\.—Federal budget receip
- Page 324 and 325: TABLE B-73.—Government receipts a
- Page 326 and 327: TABLE B-75.—State and local gover
- Page 328 and 329: TABLE B-77,—Interest-bearing publ
- Page 330 and 331: TABLE B-79-—Maturity distribution
- Page 332 and 333: TABLE B-81.—Corporate profits by
- Page 334 and 335: TABLE B-83.—Sales, profits, and s
- Page 336 and 337: TABLE B-85.—Relation of profits a
- Page 338 and 339: TABLE B-87.—Sources and uses of f
- Page 340 and 341: TABLE B-89-—State and municipal a
- Page 342 and 343: TABLE B-91.—Business formation an
- Page 344 and 345: TABLE B-93.—Farm output ami produ
- Page 346 and 347: Year or month1940194119421943194419
- Page 348 and 349: TABLE B-97.—Balance sheet of the
- Page 350 and 351: TABLE B-99— U.S. international tr
- Page 352 and 353: TABLE B-100.—U.S. merchandise exp
- Page 354 and 355: TABLE B-102.—U.S. merchandise exp
- Page 356 and 357: TABLE B-104.— World trade: Export
- Page 358 and 359: TABLE B-106.—International reserv
- Page 360 and 361: • • ' •TABLE B-108.—Industr
- Page 362 and 363:
TABLE B-110.—Summary of major U.S