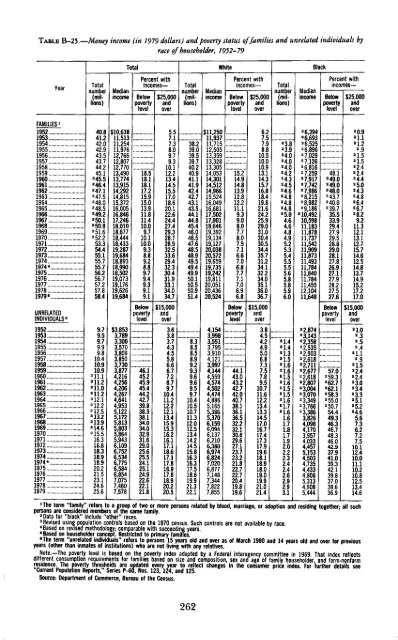
TABLE B-25.—Money income (in 1979 dollars) and poverty status <strong>of</strong> families and unrelated individuals byrace <strong>of</strong> householder, 1952-79TotalWhiteBlackYearTotalnumber(millions)MartianwieuianincomePercent withincomes—Belowpovertylevel$25,000andoverTotalnumber(millions)MedianincomePercent withincomes—Betowpovertylevel$25,000andoverTotalnumber(millions)MoHianmedianincomePercent withincomes—Belowpovertylevel$25,000andoverFAMILIES 1195219531954 ..'. ..'...19551956. " .19571958195919601961 ....1962 ..1963 . . .1964196519661967196819691970 .1971.1972 . .197319741974* . . .19751976 .. .197719781979«>UNRELATEDINDIVIDUALS*1952... .1953195419551956 .. . .19571958195919601961...1962196319641965 . . .196619671968 . . . .1969197019711972197319741974*197519761977 ...1978 . .. .197940.841.242.042 943.543.744.245.13 45.53 46.43 47.13 47.53 48.03 48.53 49.23 50.13 50.8351.63 52 253.354.455.155.755.756.256.757.257.858.49.79.59.79.99.810.410.910.93 11.13 11.23 11.03 11.23 12.13 12.23 12.53 13.23 13.93 14.63 15 516.316.818.318.918.920.221.523.124.625.6$10,6381151311,2541197612,76612,80712,77013,49013,77413.91514,29214,81515,37216,00516,84617.24618,01018,67718,44418,43319,28719,68418,89318,99018,50219,07319,17619,62619,684$3,8533,7893,3003.5703,8093,8503,7303,8774,2164,2564,2064,2674,6414,9535,1225,1725,8135,8035 8645^9436,1096,7526.5346,7756,5846,8547,0757,4607,578T&518.118.117.215.915.013.911.811.410.0• 9.710.110.09.38.89.28.89.79.49.39.19.1Belowpovertylevel46.145.245.945.444.242.739.838.338.134.034.032 93li629.025,625.524.125.124.922.622.121.85.5717.3809.79.310.112.213.414.515.517.018.620.122.624.427.429.328 728332.533.629.432.330.431.933.134.034.7$15,000and over3.63.83.74,34.55.86.66.77.28.79.710.411.212.212.113.415.915.316 216ll17.118.617.117.816.917.818.920.220.538.239 039.539.740.240.941.141,942.442.743.143.544.144.845.446.046.547.648.548.949.549.449.950.150.550.951.4"BJ 8.58.58.99.29.39.69.69.59.710.410.510.711.312.012.513 4R214.515.816.316.317.518.619.921.322.1$11,25011,93711,71512 50513,35913,32813,30514,05314,30114,51214,96615,52416,04916,68117,50217,90118,64619,3921913419,12720,03820,57219,65919,73519,24219,81120,05120,43620,5244,1543,9983,5513,7953,9104,1213,9974,1444,5594,5744,5024,4744,8865,1655,3865,3706,1596,0946 1376>106,3806,9746,8247,0206,8777,1487,3447,8227,85515 214.914.813.912.812.211.19.39.08.07.7807.97.16.67.06.87.77.17.06.96.8Belowpovertylevel"44"l43.043.242.742.040.738.136.136.532.232.130 829^627.123.723.221.822.722.720.419.819.66.27.57.98.810.510.010.913.114.315.716.818.419.821.624.225.929.031.030.430.534.435.731.234.132.234.035.136.036.7$15,000andover3.84.54.24.95.06.87.37.57.89.510.711.612.213.413.314.517.016.717 4V.317.919.618.118.918.019.019.921.021.4i'3.82 392 4.02 4.02 4.0M.2M.3M.5M.62 4.82 4.82 4.82 5.04.64.64.8495.25.35.45.55.55.65.85.85.96.0nJ 2 1.42 1.32 1.52 1.62 1.62 1.52 1.62 1.52 1.52 1.62 1.721.61.61.71.81 71./1.92.02.22.32.42.42.62.92.93.12 6,3942 6 6932 6,5252 6 8962 7,0292 7,1262 6,8162 7.2592 7,9172 7,7422 7,9862 8,2152 8,9822 9,1862 10,49210,59811,18311,8781173711,54211,90911,87311,49311,78411,84011,78411,45512,10411,6482 2 8742 3,1432 2,3582 2,5352 2 9032 2,6182 2,7112 2,6772 2,6182 2,8078 3,0042 3,0702 3,34923J662 3,3863,8264,0984,170O QC7j,yo/4,0334,4575,1534,5034,7354,4334,8065,3134,9085,444... „„...2 49.02 49.02 48.02 43.72 40.02 39.735.533.929.427.929 528.829.028.127.826.927.127.928.227.527.6Belowpovertylevel57!6"2 59.32 62.72 62.12 58.32 55.02 50.754.449.346.346.7to.o46.042.937.941.039.342.139.837.038.636.92 0.92 112 1.22 .92 1.52 1.52 2.42 2.424.425.O2 4.324.82 6.42 6.72 8 29.211.312.113112.715714.612.514.813.714.915.217.217.0$15,000and over2 10*.32.5M2 112.98 1.52 2.42 2.42 3.02 3.4*3.32 5.12 5.22 4.65.67.36.27 9/,&7.510112^410.011.110.210.812.513.414.6'The term family refers to a group <strong>of</strong> two or more persons related by blood, marriage, or adoption and residing toge<strong>the</strong>r; all suchpersons are considered members <strong>of</strong> <strong>the</strong> same family.2 Data for "black" include "o<strong>the</strong>r" races.3 Revised using population controls based on <strong>the</strong> 1970 census. Such controls are not available by race.4 Based on revised methodology; comparable with succeeding years.9 Based on householder concept. Restricted to primary families.•The term "unrelated individuals" refers to persons 15 years old and over as <strong>of</strong> March 1980 and 14 years old and over for previousyears (o<strong>the</strong>r than inmates <strong>of</strong> institutions) who are not living with any relatives... Note.—The poverty level is based on <strong>the</strong> poverty index adopted by a Federal interagency committee in 1969. That index reflectsdifferent consumption requirements for families based on size and composition, sex and age <strong>of</strong> family householder, and farm-nonfarm^ ^ Z & W ^ ^ T ^ T ^ J S K t changes in <strong>the</strong>co " sumer priceindex -Source: Department <strong>of</strong> Commerce, Bureau <strong>of</strong> <strong>the</strong> Census.For lur<strong>the</strong>r det8lssee262
TABLE B-26.—Population by age groups, 1929-80[Thousands <strong>of</strong> persons]July 1TotalAge (years)Under 5 5-15 16-19 20-24 25-44 45-6465 andover1929121,76711,73426,8009,12710,69435,86221,0766,4741933.125,57910,61226,8979,30211,15237,31922,9337,3631939130,83010,41825,1799,82211,51939,35425,8238,7641940 .194]..19421943...1944..194519461947194819491950. .1951195?.1953 .1954 .1955...1956...1957..195319591960 .1961...1962.1963196419651966196719681969132,122133,402134,860136,739138,397139,928141,389144,126146,631149,188152,271154,878157,553160,184163,026165,931168,903171,984174,882177,830180,671183,691186,538189,242191,889194,303196,560198,712200,706202,67710,57910,85011,30112,01612,52412,97913,24414,40614,91915,60.716,41017,33317,31217,63818,05718,56619,00319,49419,88720,17520,34120,52220,46920,34220,16519,82419,20818,56317,91317,37624,81124,51624,23124,09323,94923,90724,10324,46825,20925,85226,72127,27928,89430,22731,48032,68233,99435,27236,44537,36838,49439,76541,20541,62642,29742,93843,70244,24444,62244,8409,8959,8409,7309,6079,5619,3619,1199,0978 9528,7888,5428,4468,4148,4608,6378,7448,9169,1959,54310,21510,68311,02511,18012,00712,73613,51614,31114,20014,45214,80011,69011,80711,95512,06412,06212,03612,00411,81411,79411,70011,68011,55211,35011,06210,83210,71410,61610,60310,75610,96911,13411,48311,95912,71413,26913,74614,05015,24815,786-16,48039,86840,38340,86141,42042,01642,52143,02743,65744,28844,91645,67246,10346,49546,78647,00147,19447,37947,44047,33747,19247,14047,08447,01346,99446,95846,91247,00147,19447,72148,06426,24926,71827,19627,67128,13828,63029,06429,49829,93130,40530,84931,36231,88432,39432,94233,50634,05734,59135,10935,66336,20336,72237,25537,78238,33838,91639,53440,19340,84641,4379,0319,2889,5849,86710,14710,49410,82811,18511,53811,92112,39712,80313,20313,61714,07614,52514,93815,38815,80616,24816,67517,08917,45717,77818,12718,45118,75519,07119,36519,6801970.19711972..1973..19741975 .1976..19771978,.19791980204,878207,053208,846210,410211,901213,559215,152216,880218,717220,584222,80717,14817,17716,99016,69416,28815,87915,34515,24815,37815,64944,77444,44143,94843,22742,53841,95641,45940,57539,62338,643t 1 )15,27515,63515,94616,31016,59016,79316,92816,96616,93516,838t 1 )17,18418,03218,34518,74119,22919,63020,07720,46120,726(M48,43548,81150,25451,41152,59353,73555,12956,70658,38060,161t 1 )41,97542,41342,78543,07743,31943,54643,70743,79543,87643,91020,08720,48820,89221,34621,83322,42022,95423,51324,06424,6581 Not available.Note.—Includes Armed Forces overseas beginning 1940. Includes Alaska and Hawaii beginning 1950. Data from 1980 censusnot yet available.Source: Department <strong>of</strong> Commerce, Bureau <strong>of</strong> <strong>the</strong> Census.263
- Page 3:
Economic Reportof the PresidentTran
- Page 7:
ECONOMIC REPORTOF THE PRESIDENT
- Page 10 and 11:
We have heard much about American i
- Page 12 and 13:
at an approach that took account of
- Page 14 and 15:
een due to overall demand in the ec
- Page 16 and 17:
to $27.5 billion in the new budget
- Page 18 and 19:
ductions would amount to over $27 b
- Page 20 and 21:
10 percent inflation rate, keeping
- Page 22 and 23:
tutes for petroleum. The Synthetic
- Page 24 and 25:
esponse can be so large as to wipe
- Page 27:
THE ANNUAL REPORTOF THECOUNCIL OF E
- Page 31 and 32:
CONTENTSCHAPTER 1. INFLATION AND GR
- Page 33 and 34:
PageChallenges to the International
- Page 35 and 36:
CHAPTER 1Inflation and Growth in th
- Page 37 and 38:
needed to control inflation by resi
- Page 39 and 40:
decline in productivity growth may
- Page 41 and 42:
Chart 1Standard Unit Labor CostsPER
- Page 43 and 44:
end of 1974 the world price of oil
- Page 45 and 46:
price decisions cannot easily be re
- Page 47 and 48:
Federal budget achieved a surplus.
- Page 49 and 50:
As an abrupt increase in the price
- Page 51 and 52:
policies but are based on the wides
- Page 53 and 54:
tion, and can policies be designed
- Page 55 and 56:
duction and employment to grow only
- Page 57 and 58:
Moreover, their actions must indica
- Page 59 and 60:
Starting with its 1975 targets as a
- Page 61 and 62:
well after the fact whether the mon
- Page 63 and 64:
Reserve provides some flexibility i
- Page 65 and 66:
in response to circumstances in par
- Page 67 and 68:
Although the flexibility of TIPs ma
- Page 69 and 70:
ard or that thought the administrat
- Page 71 and 72:
given standard, as the reward and t
- Page 73 and 74:
large firms. Even among large firms
- Page 75 and 76:
cause declining productivity growth
- Page 77 and 78:
vanced technology and will therefor
- Page 79 and 80:
ather than restoring the growth of
- Page 81 and 82:
correct some of the distortions in
- Page 83 and 84:
higher than it would otherwise be b
- Page 85 and 86:
EXPECTED PRODUCTIVITY GAINSAlthough
- Page 87 and 88:
supply of adult men in the work for
- Page 89 and 90:
increase demand pressures, especial
- Page 91 and 92:
time hours also has drawbacks. For
- Page 93 and 94:
eintroduce the problem of changing
- Page 95 and 96:
CHAPTER 2Improving the Adaptability
- Page 97 and 98:
use less and produce more energy in
- Page 99 and 100:
expectation of price controls or fu
- Page 101 and 102:
dependence on foreign oil mean that
- Page 103 and 104:
While the market solution might pro
- Page 105 and 106:
High energy prices and excessive de
- Page 107 and 108:
part, the interests of these partie
- Page 109 and 110:
Federal regulations designed to pro
- Page 111 and 112:
Agency (EPA) from considering prosp
- Page 113 and 114:
other things, that federally assist
- Page 115 and 116:
ing services. Money-market mutual f
- Page 117 and 118:
holdings of consumer and business l
- Page 119 and 120:
they once had and thus cannot conti
- Page 121 and 122:
finding ways around outdated regula
- Page 123 and 124:
proportion of the existing farms pr
- Page 125 and 126:
prices for years in the future, reg
- Page 127 and 128:
derground water resources once thou
- Page 129 and 130:
comprehensive, actuarial crop insur
- Page 131 and 132:
duced a decline in the median age o
- Page 133 and 134:
elude government investments in loc
- Page 135 and 136:
some of the firms in the chosen sec
- Page 137 and 138:
CHAPTER 3The Economy: Review and Pr
- Page 139 and 140:
uild up oil inventories and maintai
- Page 141 and 142:
Chart 7Selected Interest Ratesand B
- Page 143 and 144:
had risen just 2 months earlier. By
- Page 145 and 146:
Chart 8Personal Saving RatePERCENT1
- Page 147 and 148:
chief cyclical determinant of housi
- Page 149 and 150:
ment were sharply diminished by the
- Page 151 and 152:
dropped even faster, in large part
- Page 153 and 154:
ployment grew more vigorously after
- Page 155 and 156:
terials fell for a full third of th
- Page 157 and 158:
1979, slowed to a 19 percent annual
- Page 159 and 160:
costs of production. The evidence s
- Page 161 and 162:
sharp decline in output in the seco
- Page 163 and 164:
ecord high interest rates during th
- Page 165 and 166:
automatic transfer services (ATS) n
- Page 167 and 168:
plunged in March, although the only
- Page 169 and 170:
(FHLB) System increased their borro
- Page 171 and 172:
THE PROSPECTS FOR 1981 AND 1982In 1
- Page 173 and 174:
expectations. Of course, if the eco
- Page 175 and 176:
The uncertainty of developments in
- Page 177 and 178:
produce a slight decline in the sav
- Page 179 and 180:
more rapid growth thereafter. Durin
- Page 181 and 182:
eemergence of modest but sustained
- Page 183 and 184:
hike would depend on many factors,
- Page 185 and 186:
major revision of the NIPA occurred
- Page 187 and 188:
per year. This modest acceleration
- Page 189 and 190:
THE INDUSTRIAL ECONOMIES: TRENDS AN
- Page 191 and 192:
Chart 10Labor Costs, Value-Added De
- Page 193 and 194:
Rather, the German current account
- Page 195 and 196:
TABLE 30.—Inflation in major indu
- Page 197 and 198:
THE GLOBAL OIL MARKETTable 31 summa
- Page 199 and 200:
may be preserved. Stocks are in fac
- Page 201 and 202:
straint on growth. Finally, policie
- Page 203 and 204:
outside government, both at home an
- Page 205 and 206:
ates are high, differences in polic
- Page 207 and 208:
Japanese trade performance in volum
- Page 209 and 210:
No "Say's Law" operates in internat
- Page 211 and 212:
the cost of the loans, and they may
- Page 213 and 214:
At the same time, access to the IMF
- Page 215 and 216:
to closer cooperation is to risk a
- Page 217 and 218: While all countries, in attempting
- Page 219: threats of disruption, market-shari
- Page 223: LETTER OF TRANSMITTALCOUNCIL OF ECO
- Page 226 and 227: Past Council Members and their date
- Page 228 and 229: 1977 to review selected analyses of
- Page 230 and 231: The Chairman and the Council Member
- Page 232 and 233: University). Kate Stith Pressman, s
- Page 235 and 236: CONTENTSNATIONAL INCOME OR EXPENDIT
- Page 237 and 238: GOVERNMENT FINANCE'—ContinuedB-72
- Page 239 and 240: NATIONAL INCOME OR EXPENDITURETABLE
- Page 241 and 242: TABLE B-2.—Gross national product
- Page 243 and 244: TABLE B-3.—Implicit price deflato
- Page 245 and 246: TABLE B-5.—Implicit price deflato
- Page 247 and 248: TABLE B-7.—Gross national product
- Page 249 and 250: TABLE B-8.—Gross national product
- Page 251 and 252: TABLE B-10.—Gross national produc
- Page 253 and 254: TABLE B-12.—Output, costs, and pr
- Page 255 and 256: TABLE B-14.—Gross private domesti
- Page 257 and 258: TABLE B-16.—Inventories and final
- Page 259 and 260: TABLE B-18.—Relation of national
- Page 261 and 262: TABLE B-19-—National income by ty
- Page 263 and 264: Year orquarter192919331939194019411
- Page 265 and 266: TABLE B-22.—Total and per capita
- Page 267: Year orquarterTotalTotalCurrencyand
- Page 271 and 272: TABLE B-27.—Noninstitutional popu
- Page 273 and 274: Year or monthTABLE B-29.—Selected
- Page 275 and 276: TABLE B-31.—Unemployment rate by
- Page 277 and 278: TABLE B-33.—Unemployment by reaso
- Page 279 and 280: TABLE B-35.—Wage and salary worke
- Page 281 and 282: TABLE B-37.—Average weekly earnin
- Page 283 and 284: TABLE B-39.—Changes in productivi
- Page 286 and 287: TABLE B-42.—Industrial production
- Page 288 and 289: TABLE B-44;—New construction acti
- Page 290 and 291: TABLE B-45.—New housing units sta
- Page 292 and 293: TABLE B-47.—Sales and inventories
- Page 294 and 295: TABLE B-49.—Manufacturers' new an
- Page 296 and 297: TABLE B-51.—Consumer price indexe
- Page 298 and 299: 19391940194119421943194419451946194
- Page 300 and 301: TABLE B-54.—Changes in special co
- Page 302 and 303: TABLE B-55.—Producer price indexe
- Page 304 and 305: TABLE B-57.—Producer price indexe
- Page 306 and 307: TABLE B-58.—Changes in producer p
- Page 308 and 309: TABLE B-60.—Components of money s
- Page 310 and 311: TABLE B-62.— Total funds raised i
- Page 312 and 313: TABLE B-63.—Federal Reserve Bank
- Page 314 and 315: TABLE B-65.—Bond yields and inter
- Page 316 and 317: TABLE B-66—Consumer credit outsta
- Page 318 and 319:
TABLE B-68.—Mortgage debt outstan
- Page 320 and 321:
GOVERNMENT FINANCETABLE B-70.—Fed
- Page 322 and 323:
TABLE B-l\.—Federal budget receip
- Page 324 and 325:
TABLE B-73.—Government receipts a
- Page 326 and 327:
TABLE B-75.—State and local gover
- Page 328 and 329:
TABLE B-77,—Interest-bearing publ
- Page 330 and 331:
TABLE B-79-—Maturity distribution
- Page 332 and 333:
TABLE B-81.—Corporate profits by
- Page 334 and 335:
TABLE B-83.—Sales, profits, and s
- Page 336 and 337:
TABLE B-85.—Relation of profits a
- Page 338 and 339:
TABLE B-87.—Sources and uses of f
- Page 340 and 341:
TABLE B-89-—State and municipal a
- Page 342 and 343:
TABLE B-91.—Business formation an
- Page 344 and 345:
TABLE B-93.—Farm output ami produ
- Page 346 and 347:
Year or month1940194119421943194419
- Page 348 and 349:
TABLE B-97.—Balance sheet of the
- Page 350 and 351:
TABLE B-99— U.S. international tr
- Page 352 and 353:
TABLE B-100.—U.S. merchandise exp
- Page 354 and 355:
TABLE B-102.—U.S. merchandise exp
- Page 356 and 357:
TABLE B-104.— World trade: Export
- Page 358 and 359:
TABLE B-106.—International reserv
- Page 360 and 361:
• • ' •TABLE B-108.—Industr
- Page 362 and 363:
TABLE B-110.—Summary of major U.S