TABLE B-47.—Sales and inventories in manufacturing and trade, 1947-80[Amounts in millions <strong>of</strong> dollars; monthly data seasonally adjusted]Year or monthTotal manufacturing andManufacturingMerchant wholesalersRetail tradetradeSales'Inventories2 Ratio3 Sales 1tories Inven-2Inventories2 Ratio* Sales'Ratio3 Sales'Inventories2 Ratio335,26033,78838,59643,35644,84047,98746,44351,69454,06355,87954,20159,72960,82761,15965,66268,99573,68252,50749,49759,82270,24272,37776,12273,17579,51687,30489,05287,09392,12994,71395,594101,063105,480111,5031.421.531.361.551.581.581.601.471.551.591.601.501.561.541.501.491.4715,51317,31616,12618,63421,71422,52924,84323,35526,48027,74028,73627,24730,28630,87930,92333,35735,05837,33125,89728,54326,32131,07839,30641,13643,94841,61245,06950,64251,87150,24152,94553,78054,88558,18660,04663,4091.581.571.751.481.661.781.761.811.621.731.801.841.701.751.741.701.691.646,8086,5147,6958,5978,7829,0528,9939,89310,51310,47510,25711,49111,65611,98812,67413,38214,5297,9577,7069,2849,88610,21010,68610,63711,67813,26012,73012,73913,87914,12014,48814,93616,04817,0001.131.191.071.161.121.171.181.131.191.231.241.151.221.201.161.151.1410,20011,13511,14912,26813,04613,52914,09114,09515,32115,81116,66716,69617,95118,29418,24919,63020,55621,82314,24116,00715,47019,46021,05021,03121,48820,92622,76923,40224,45124,11325,30526,81326,22127,94129,38631,0941.261.391.411.381.641.521.531.511.431.471.441.431.401.451.431.381.391.4080,28387,18790,34898,143105,042120,907136,790145,335156,166169,8411.451.471.561.541.5540,99544,87046,48750,26853,54068,18577,95284,65990,61798,2101.601.621.761.741.7715,61116,98719,44820,84622,60918,31720,76525,37726,60429,1141.151.151.251.251.2323,67725,33024,41327,03028,89334,40538,07335,29938,94542,5171.391.441.431.381.41107,475116,035130,049152,237175,741178,337188,563203,161234,163285,5191.621.581.501.431.4752,83255,92563,04272,95484,821101,667102,677108,296124,672157,9151.901.831.671.581.6523,94326,25729,58436,82245,83632,80335,82339,78646,25456,5371.291.301.271.171.1230,70033,85337,42242,46145,08343,86750,06355,07963,23771,0671.411.411.401.401.48180,263202,001224,786254,297288,388285,035310,736337,432380,643426,7961.581.481.441.411.4186,61798,810110,842124,714141,000158,178170,156180,224198,334228,2581.831.661.591.521.5244,63353,50962,84273,55155,11361,30767,99880,77189,6761.241.211.211.191.1749,01354,78460,43566,74173,83771,74479,27389,210101,538108,8621.441.381.391.431.45274,091274,844283,741276,406286,413283,772385,379389,312392,630398,307401,945406,7201.411.421.381.441.401.43135,213135,718141,039134,398141,783139,050201,143203,819205,752209,175210,881213,9421.491.501.461.561.491.5467,58567,86070,65770,40272,33872,62981,49882,70083,55884,63284,90485,4061.211.221.181.201.171.1871,29371,26672,04571,60672,29272,093102,738102,793103,320104,500106,160107,3721.441.441.431.461.471.49289,994293,167296,760298,452298,949302,117413,581417,130418,461422,710425,952426,7961.431.421.411.421.431.41142,094142,708143,614145,547144,326146,289216,120218,669221,341223,476226,483228,2581.521.531.541.541.571.5674,77875,58876,48077,32278,20378,67887,66288,28088,37288,81989,6761.171.171.161.151.141.1473,12174,87176,66675,58376,42177,150109,799110,181108,748110,415110,383108,8621.501.471.421.461.441.41312,458310,181305,165294,998292,478294,203304,154308,019318,321325,838329,140431,420435,155439,114445,170445,801447,031449,510451,951454,566456,532458,2351.381.401.441.511.521.521.481.471.431.401.39152,088152,889150,081143,596141,515141,573145,678146,643152,764156,697158,386232,294235,096238,522242,540243,402243,630244,105243,517243,615242,876244,1861.531.541.591.691.721.721.681.661.591.551.5480,90679,29978,55076,39176,37676,62980,18982,60685,47088,53288,82190,69091,34291,49792,37892,56293,63394,61997,11198,11199,27599,8791.121.151.171.211.211.221.181.181.151.121.1279,46477,99376,53475,01174,58776,00178,28778,77080,08780,60981,93380,830108,436108,717109,095110,252109,837109,768110,786111,323112,840114,381114,1701 Monthly average for year and total for month.2 Seasonally adjusted, end <strong>of</strong> period.3 Inventory/sales ratio. For annual periods, ratio <strong>of</strong> weighted average inventories to average monthly sales; for monthly data, ratio <strong>of</strong>inventories at end <strong>of</strong> month to sales for month.Note.—Earlier data are not strictly comparable with data beginning 1958 for manufacturing and beginning 1967 for wholesale andThe inventory figures in this table do not agree with <strong>the</strong> estimates <strong>of</strong> change in business inventories included in <strong>the</strong> gross nationalproduct since <strong>the</strong>se figures cover only manufacturing and trade ra<strong>the</strong>r than all Dusiness, and show inventories in terms <strong>of</strong> current bookvalue without adjustment for revaluation.Source: Department <strong>of</strong> Commerce (Bureau <strong>of</strong> <strong>Economic</strong> Analysis and Bureau <strong>of</strong> <strong>the</strong> Census).2861.361.391.431.471.471.441.421.411.411.421.39
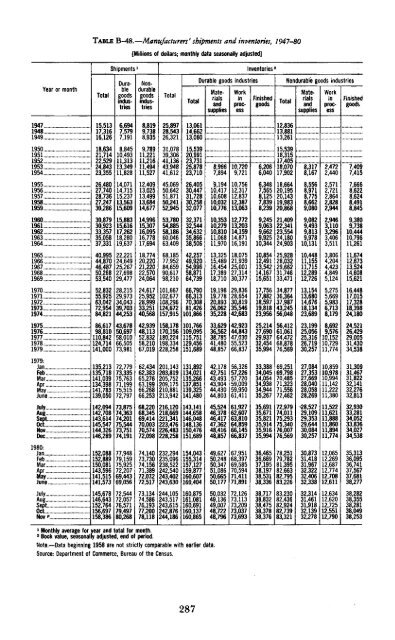
TABLE B-48.—Manufacturers' shipments and inventories, 1947-80[Millions <strong>of</strong> dollars; monthly data seasonally adjusted]Year or month1947 ..1948..1949...1950 ..1951..19521953 .1954 ,1955.1956..1957..1958..1959I9601961.1962 .19631964 .1965196619671968.1969.1970 ..1971. ..1972 ..1973 ...1974 .. .1975197619771978 .19791979:Jan..Feb.Mar...Apr....May.June.July .Aug...Sept..Oct..NovDec .1980:JanFeb..Mar.fc:June..July .Aug .SeptOct..Nov.Shipments 1Total15,51317,31616,12618,63421,71422,52924,84323,35526,48027,74028,73627,24730,28630,87930,92333,35735,05837,33140,99544,87046,48750,26853,54052,83255,92563,04272,95484,82186,61798,810110,842124,714141,000135,213135,718141,039134,398141,783139,050142,094142,708143,614145,547144,326146,289152,088152,889150,081143,596141,515141,573145,678146,643152,764156,697158,386Durableindustries6,6947,5797,1918,84510,49311,31313,34911,82814,07114,71515,23713,56315,60915,88315,61617,26218,28019,63722,22124,64925,26727,69829,47728,21529,97334,04339,70344,25343,67850,69758,01066,50573,98172,77973,33575,76371,19975,51572,79773,87574,36374,20175,54473,75174,19177,94879,15975,92572,20769,44369,05672,54472,05776,57179,49780,268Nondurablegoodsindustries8,8199,7388,9359,78911,22111,21611,49411,52712,40913,02513,49913,68414,67714,99615,30716,09516,77817,69418,77420,22021,22022,57024,06424,61725,95228,99933,25140,56842,93948,11352,83258,21067,01962,43462,38365,27663,19966,26866,25368,22068,34569,41470,00370,57472,09874,14073,73074,15671,38972,07.272,51773,13474,58676,19377,20078,118Inventories 2Total25,89728,54326,32131,07839,30641,13643,94841,61245,06950,64251,87150,24152,94553,78054,88558,18660,04663,40968,18577,95284,65990,61798,210101,667102,677108,296124,672157,915158,178170,156180,224198,334228,258201,143203,819205,752209,175210,881213,942216,120218,669221,341223,476226,483228,258232,294235,096238,522242,540243,402243,630244,105243,517243,615242,876244,186Durable goods industriesTotal13,06114,66213,06015,53920,99123,73125,87823,71026,40530,44731,72830,25832,07732,37132,54434,63235,86638,50642,25749,92054,99658,87164,73966,79066,31370,30881,426101,866101,766109,095115,751129,456151,689131,892134,021135,266137,851139,325141,480143,141144,658146,048148,136150,476151,689154,043155,314157,127159,877160,607160,404160,875161,081160,691160,137160,865Materialsandsupplies8,9667,89419,19410,41710,60810,03210,77610,35310,27910,81011,06811,97013,32515,48916,45417,38918,71019,19819,77820,89326,06235,22833,62936,56238,78541,48048,85742,17842,75143,49343,90444,43044,80345,52446,37846,41747,36248,41648,85749,62750,24850,34751,08650,66550,17750,03249,13649,00748,72248,796Workmproc-10,7209,72110,75612,31712,83712,38713,06312,77213,20314,15914,87116,19118,07521,93925,00127,31430,37729,83628,65430,81935,54642,68342,92344,84347,03055,52366,83756,32657,22657,72059,00959,95061,41161,92762,60763,81064,85966,14566,83767,95168,39769,58570,59471,41171,89172,12673,11373,20973,03773,693Finishedgoods6,2066,0406,3487,5658,1257,8398,2399,2459,0639,6629,92510,34410,85412,49113,54214,16715,65117,75617,88218,59719,81823,95625,21427,69029,93732,45435,99433,38834,04534,05434,93834,94435,26735,69135,67135,82135,91435,91635,99436,46536,66937,19538,19738,53138,33638,71738,83238,47538,37838,376Nondurable goods industriesTotal12,83613,88113,26115,53918,31517,40518,07017,90218,66420,19520,14319,98320,86821,40922,34123,55424,18024,90325,92828,03229,66231,74633,47134,87736,36437,98743,24556,04856,41261,06164,47268,87876,56969,25169,79870,48571,32371,55672,46272,97974,01175,29375,34076,00776,56978,25179,78281,39582,66382,79583,22683,23082,43682,92482,73983,321Materialsandsupplies8,3178,1678,5568,9718,7758,6629,0809,0829,4939,8139,97810,13110,44811,15511,71512,28912,72613,15413,68014,67618,13423,68923,19925,05625,31626,71930,25727,08427,35327,66928,04028,05828,269-28,52729,10929,35329,64430,08430,25730,87331,41831,96732,32232,40632,33832,31431,46131,91832,13932,278Workinproc-2,4722,4402,5712,7212,8642,8282,9442,9463,1103,2963,4063,5113,8064,2044,4234,8495,1245,2755,6695,9836,7138,1798,6929,57610,15210,72911,77410,85910,97810,99411,14211,22211,38011,52211,62111,88811,86011,89411,77412,06512,26912,68712,77412,70812,61112,63412,62012,72512,55112,790Finishedgoods7,4097,4157,6668,6228,6248,4918,8459,3809,73810,44410,79611,26111,67412,67313,52414,60815,62116,44817,01517,32818,39824,18024,52126,42929,00531,43034,53831,30931,46731,82232,14132,27632,81332,93033,28134,05233,83634,02734,53835,31336,09536,74137,56737,68138,27738,28238,35538,28138,04938,2531 Monthly average for year and total for month.2 Book value, seasonally adjusted, end <strong>of</strong> period.Note.—Data beginning 1958 are not strictly comparable with earlier data.Source: Department <strong>of</strong> Commerce, Bureau <strong>of</strong> <strong>the</strong> Census.287
- Page 3:
Economic Reportof the PresidentTran
- Page 7:
ECONOMIC REPORTOF THE PRESIDENT
- Page 10 and 11:
We have heard much about American i
- Page 12 and 13:
at an approach that took account of
- Page 14 and 15:
een due to overall demand in the ec
- Page 16 and 17:
to $27.5 billion in the new budget
- Page 18 and 19:
ductions would amount to over $27 b
- Page 20 and 21:
10 percent inflation rate, keeping
- Page 22 and 23:
tutes for petroleum. The Synthetic
- Page 24 and 25:
esponse can be so large as to wipe
- Page 27:
THE ANNUAL REPORTOF THECOUNCIL OF E
- Page 31 and 32:
CONTENTSCHAPTER 1. INFLATION AND GR
- Page 33 and 34:
PageChallenges to the International
- Page 35 and 36:
CHAPTER 1Inflation and Growth in th
- Page 37 and 38:
needed to control inflation by resi
- Page 39 and 40:
decline in productivity growth may
- Page 41 and 42:
Chart 1Standard Unit Labor CostsPER
- Page 43 and 44:
end of 1974 the world price of oil
- Page 45 and 46:
price decisions cannot easily be re
- Page 47 and 48:
Federal budget achieved a surplus.
- Page 49 and 50:
As an abrupt increase in the price
- Page 51 and 52:
policies but are based on the wides
- Page 53 and 54:
tion, and can policies be designed
- Page 55 and 56:
duction and employment to grow only
- Page 57 and 58:
Moreover, their actions must indica
- Page 59 and 60:
Starting with its 1975 targets as a
- Page 61 and 62:
well after the fact whether the mon
- Page 63 and 64:
Reserve provides some flexibility i
- Page 65 and 66:
in response to circumstances in par
- Page 67 and 68:
Although the flexibility of TIPs ma
- Page 69 and 70:
ard or that thought the administrat
- Page 71 and 72:
given standard, as the reward and t
- Page 73 and 74:
large firms. Even among large firms
- Page 75 and 76:
cause declining productivity growth
- Page 77 and 78:
vanced technology and will therefor
- Page 79 and 80:
ather than restoring the growth of
- Page 81 and 82:
correct some of the distortions in
- Page 83 and 84:
higher than it would otherwise be b
- Page 85 and 86:
EXPECTED PRODUCTIVITY GAINSAlthough
- Page 87 and 88:
supply of adult men in the work for
- Page 89 and 90:
increase demand pressures, especial
- Page 91 and 92:
time hours also has drawbacks. For
- Page 93 and 94:
eintroduce the problem of changing
- Page 95 and 96:
CHAPTER 2Improving the Adaptability
- Page 97 and 98:
use less and produce more energy in
- Page 99 and 100:
expectation of price controls or fu
- Page 101 and 102:
dependence on foreign oil mean that
- Page 103 and 104:
While the market solution might pro
- Page 105 and 106:
High energy prices and excessive de
- Page 107 and 108:
part, the interests of these partie
- Page 109 and 110:
Federal regulations designed to pro
- Page 111 and 112:
Agency (EPA) from considering prosp
- Page 113 and 114:
other things, that federally assist
- Page 115 and 116:
ing services. Money-market mutual f
- Page 117 and 118:
holdings of consumer and business l
- Page 119 and 120:
they once had and thus cannot conti
- Page 121 and 122:
finding ways around outdated regula
- Page 123 and 124:
proportion of the existing farms pr
- Page 125 and 126:
prices for years in the future, reg
- Page 127 and 128:
derground water resources once thou
- Page 129 and 130:
comprehensive, actuarial crop insur
- Page 131 and 132:
duced a decline in the median age o
- Page 133 and 134:
elude government investments in loc
- Page 135 and 136:
some of the firms in the chosen sec
- Page 137 and 138:
CHAPTER 3The Economy: Review and Pr
- Page 139 and 140:
uild up oil inventories and maintai
- Page 141 and 142:
Chart 7Selected Interest Ratesand B
- Page 143 and 144:
had risen just 2 months earlier. By
- Page 145 and 146:
Chart 8Personal Saving RatePERCENT1
- Page 147 and 148:
chief cyclical determinant of housi
- Page 149 and 150:
ment were sharply diminished by the
- Page 151 and 152:
dropped even faster, in large part
- Page 153 and 154:
ployment grew more vigorously after
- Page 155 and 156:
terials fell for a full third of th
- Page 157 and 158:
1979, slowed to a 19 percent annual
- Page 159 and 160:
costs of production. The evidence s
- Page 161 and 162:
sharp decline in output in the seco
- Page 163 and 164:
ecord high interest rates during th
- Page 165 and 166:
automatic transfer services (ATS) n
- Page 167 and 168:
plunged in March, although the only
- Page 169 and 170:
(FHLB) System increased their borro
- Page 171 and 172:
THE PROSPECTS FOR 1981 AND 1982In 1
- Page 173 and 174:
expectations. Of course, if the eco
- Page 175 and 176:
The uncertainty of developments in
- Page 177 and 178:
produce a slight decline in the sav
- Page 179 and 180:
more rapid growth thereafter. Durin
- Page 181 and 182:
eemergence of modest but sustained
- Page 183 and 184:
hike would depend on many factors,
- Page 185 and 186:
major revision of the NIPA occurred
- Page 187 and 188:
per year. This modest acceleration
- Page 189 and 190:
THE INDUSTRIAL ECONOMIES: TRENDS AN
- Page 191 and 192:
Chart 10Labor Costs, Value-Added De
- Page 193 and 194:
Rather, the German current account
- Page 195 and 196:
TABLE 30.—Inflation in major indu
- Page 197 and 198:
THE GLOBAL OIL MARKETTable 31 summa
- Page 199 and 200:
may be preserved. Stocks are in fac
- Page 201 and 202:
straint on growth. Finally, policie
- Page 203 and 204:
outside government, both at home an
- Page 205 and 206:
ates are high, differences in polic
- Page 207 and 208:
Japanese trade performance in volum
- Page 209 and 210:
No "Say's Law" operates in internat
- Page 211 and 212:
the cost of the loans, and they may
- Page 213 and 214:
At the same time, access to the IMF
- Page 215 and 216:
to closer cooperation is to risk a
- Page 217 and 218:
While all countries, in attempting
- Page 219:
threats of disruption, market-shari
- Page 223:
LETTER OF TRANSMITTALCOUNCIL OF ECO
- Page 226 and 227:
Past Council Members and their date
- Page 228 and 229:
1977 to review selected analyses of
- Page 230 and 231:
The Chairman and the Council Member
- Page 232 and 233:
University). Kate Stith Pressman, s
- Page 235 and 236:
CONTENTSNATIONAL INCOME OR EXPENDIT
- Page 237 and 238:
GOVERNMENT FINANCE'—ContinuedB-72
- Page 239 and 240:
NATIONAL INCOME OR EXPENDITURETABLE
- Page 241 and 242: TABLE B-2.—Gross national product
- Page 243 and 244: TABLE B-3.—Implicit price deflato
- Page 245 and 246: TABLE B-5.—Implicit price deflato
- Page 247 and 248: TABLE B-7.—Gross national product
- Page 249 and 250: TABLE B-8.—Gross national product
- Page 251 and 252: TABLE B-10.—Gross national produc
- Page 253 and 254: TABLE B-12.—Output, costs, and pr
- Page 255 and 256: TABLE B-14.—Gross private domesti
- Page 257 and 258: TABLE B-16.—Inventories and final
- Page 259 and 260: TABLE B-18.—Relation of national
- Page 261 and 262: TABLE B-19-—National income by ty
- Page 263 and 264: Year orquarter192919331939194019411
- Page 265 and 266: TABLE B-22.—Total and per capita
- Page 267 and 268: Year orquarterTotalTotalCurrencyand
- Page 269 and 270: TABLE B-26.—Population by age gro
- Page 271 and 272: TABLE B-27.—Noninstitutional popu
- Page 273 and 274: Year or monthTABLE B-29.—Selected
- Page 275 and 276: TABLE B-31.—Unemployment rate by
- Page 277 and 278: TABLE B-33.—Unemployment by reaso
- Page 279 and 280: TABLE B-35.—Wage and salary worke
- Page 281 and 282: TABLE B-37.—Average weekly earnin
- Page 283 and 284: TABLE B-39.—Changes in productivi
- Page 286 and 287: TABLE B-42.—Industrial production
- Page 288 and 289: TABLE B-44;—New construction acti
- Page 290 and 291: TABLE B-45.—New housing units sta
- Page 294 and 295: TABLE B-49.—Manufacturers' new an
- Page 296 and 297: TABLE B-51.—Consumer price indexe
- Page 298 and 299: 19391940194119421943194419451946194
- Page 300 and 301: TABLE B-54.—Changes in special co
- Page 302 and 303: TABLE B-55.—Producer price indexe
- Page 304 and 305: TABLE B-57.—Producer price indexe
- Page 306 and 307: TABLE B-58.—Changes in producer p
- Page 308 and 309: TABLE B-60.—Components of money s
- Page 310 and 311: TABLE B-62.— Total funds raised i
- Page 312 and 313: TABLE B-63.—Federal Reserve Bank
- Page 314 and 315: TABLE B-65.—Bond yields and inter
- Page 316 and 317: TABLE B-66—Consumer credit outsta
- Page 318 and 319: TABLE B-68.—Mortgage debt outstan
- Page 320 and 321: GOVERNMENT FINANCETABLE B-70.—Fed
- Page 322 and 323: TABLE B-l\.—Federal budget receip
- Page 324 and 325: TABLE B-73.—Government receipts a
- Page 326 and 327: TABLE B-75.—State and local gover
- Page 328 and 329: TABLE B-77,—Interest-bearing publ
- Page 330 and 331: TABLE B-79-—Maturity distribution
- Page 332 and 333: TABLE B-81.—Corporate profits by
- Page 334 and 335: TABLE B-83.—Sales, profits, and s
- Page 336 and 337: TABLE B-85.—Relation of profits a
- Page 338 and 339: TABLE B-87.—Sources and uses of f
- Page 340 and 341: TABLE B-89-—State and municipal a
- Page 342 and 343:
TABLE B-91.—Business formation an
- Page 344 and 345:
TABLE B-93.—Farm output ami produ
- Page 346 and 347:
Year or month1940194119421943194419
- Page 348 and 349:
TABLE B-97.—Balance sheet of the
- Page 350 and 351:
TABLE B-99— U.S. international tr
- Page 352 and 353:
TABLE B-100.—U.S. merchandise exp
- Page 354 and 355:
TABLE B-102.—U.S. merchandise exp
- Page 356 and 357:
TABLE B-104.— World trade: Export
- Page 358 and 359:
TABLE B-106.—International reserv
- Page 360 and 361:
• • ' •TABLE B-108.—Industr
- Page 362 and 363:
TABLE B-110.—Summary of major U.S