TABLE B-91.—Business formation and business failures, 1929-80Business failures 1Year or monthIndexfit nat or netbusinessformation(1967=100)Newbusinessincorporations(number)Businessfailurerate 2TotalNumber <strong>of</strong> failuresLiability size classUnder$100,000$100,000and overAmount <strong>of</strong> current liabilities(millions <strong>of</strong> dollars)TotalLiability size classUnder$100,000$100,000and over19291933 n1939 31940194119421943194419451946194719481949,1950..19511952195319541955195619571958195919601961196219631964196519661967196819691970197119721973197419751976197719781979104.8 "86.490.890.194.592.490.898.295.491.491.198.194.591.192.894.798.099.598.9100.0107.6113.5107.1109.5115.5115.5111.2108.8117.2126.5132.9131.7132 916112,89796,34685,64093.09283,77892,946102,706117,411139,915141,163137,112150 781193,067182,713181,535182,057186,404197,724203,897200,010206,569233,635274,267264,209287,577316,601329,358319,149326,345375,766432,172478,019524,565103.9100 369.663.054.444.616.46.54.25214.320.434.434.330.728.733,242.041.648.051.755 951.857.064.460.856.353.253.351.649.038.637.343.841.738.336.438.442.634.828.423.927.822,90919,85914,76813,61911,8489,4053,2211,2228091,1293,4745,2509,2469,1628,0587,6118,86211,08610,96912,68613,73914,96414,05315,44517,07515,78214,37413,50113,51413,06112,3649,6369,15410,74810,3269,5669,3459,91511,4329,6287,9196,6197,56422,16518,88014,54113,40011,6859,2823,1551,1767591,0033,1034,8538,7088,7467,6267,0818,07510,22610,11311,61512,54713,49912,70713,65015,00613,77212,19211,34611,34010,83310,1447,8297,1928,0197,6117,0406,6276,7337,5046,1764,8613,7123,9307449791112191631236646501263713975384164325307878608561,0711,1921,4651.3461,7952,0692,0102,1822,1552,1742,2282,2201,8071,9622,7292,7152,5262,7183,1823,9283,4523,0582,9073,634483.3457.5182.5166.7136.1100.845.331.730.267.3204.6234.6308.1248.3259.5283.3394.2462.6449.4562.7615.3728.3692.8938.61,090.11,213.61,352.61,329.21,321.71,385.71,265.2941.01,142.11,887.81,916.92,000.22,298.63,053.14,380.23,011.33,095.32,656.02,667.4261.5215.5132.9119.9100.780.330.214.511.415.763.793.9161.4151.2131.6131.9167.5211.4206.4239.8267.1297.6278.9327.2370.1346.5321.0313.6321.7321.5297.9241.1231.3269.3271.3258.8235.6256.9298.6257.8208.3164.7179.9221.8242.049.746.835.420.515.117.118.851.6140.9140.7146.797.1128.0151.4226.6251.2243.0322.9348.2430.7413.9611.4720.0867.11,031.61,015.61,000.01,064.1967.3699.9910.81,618.41,645.61,741.52,063.02,796.34,081.62,753.42,887.02,491.32,487.55easonally adjusted1979:JanFeb."..Mar ..AprMayJune131.3132.1132.5130.9130.5130.942,41042,30242,76143 03443 89543,04427.424.427.930 829126.2642545732734708602355291379397380307287254353337328295182.2177.1187.8242.8200 4273.215.112.818.016,816.813.8167.1164.3169.8226.0183.7259.4JulvAugSeptOctNovDec1318130.3132.5131.9131.4133.944 65542,91144,68746,47844,81143,57927 532.926.133.623.124,9565736505767519509285412248374260242280324257393259267212 2287.4186.2395.8184.3138.013918.011.417.513.712.2198 3269.4174.8378.3170.6125.81980:Jan,Feb.. . .Mar .ft June ...v .131.0129.8125.8120.5117.8114.844,44744,58342,61542,46141,97439,74630.927.536.242.239.348.77296779251,0689751,094363330452525452522366347473543523572243.1190.8274.2428.2381.1436.717.015.521.724.422.025.2226.2175.3252.5403.8359.2411.5JulyAugSeptOct115.3117.7120.6117.644,05843,26646,48847,22552.045.445.01,1411,0099261,340531486465610523461445.7345.41,002.926.323.222.2419.4322.2980.71 Commercial and industrial failures only. Excludes failures <strong>of</strong> banks and railroads and, beginning 1933, <strong>of</strong> real estate, insurance,holding, and financial companies, steamship lines, travel agencies, etc.2 Failure rate per 10,000 listed enterprises." Series revised; not strictly comparable with earlier data.Sources: Department <strong>of</strong> Commerce (Bureau <strong>of</strong> <strong>Economic</strong> Analysis) and Dun & Bradstreet, Inc.336
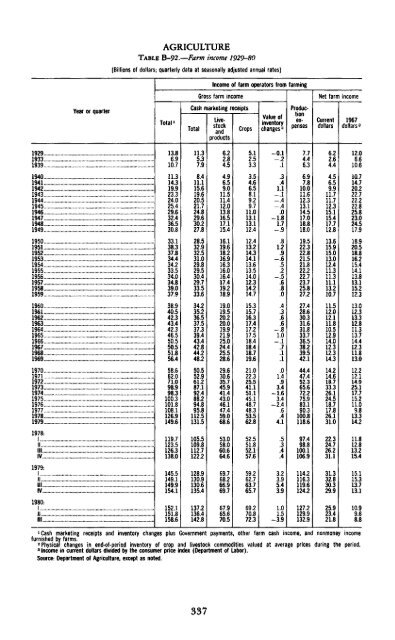
AGRICULTURETABLE B-92.—Farm income 1929-80[Billions <strong>of</strong> dollars; Quarterly data at seasonally adjusted annual rates]Income <strong>of</strong> farm operators from farmingGross farm incomeNet farm incomeYear or quarterTotal 1Cash marketing receiptsTotalLivestockandproductsCropsValue <strong>of</strong>inventorychanges 2Produc-ex-pensesCurrentdollars1967dollars 3192919331939 ....19401941194219431944194519461947194819491950195119521953195419551956195719581959I96019611962196319641965196619671968196919701971197219731974 . . . .197519761977197819791978:j||IIIIV1979:I||IllIV1980:I|| , ...Ill13.86910.711.314.319.923.324.025.429.632.436.530.833138 337.834 434.233 534.034 839.037.938940.542 343.442 346.550 550.551856.458 662 071.098.998.3100 31018108.1126.9149.6119.7123.5126.3138.0145.5149.1149.9154.115211518158.611.35.37.98.411.115.619.620.521.724.829.6'30.227.828.532.932.531.029.829.530.429.733.533.634.235.236.537.537.339.443.442.844.248.250.552 961.287.192.488.294 895.8112.5131.5105.5109.8112.7122.2128.9130.9130.6135.4137.2136.4142.86.2284.54.96.59.011.511.412.013.816.517.115.416.119 618.216.916.316016.417 419.218.919.019.520.220.019.921.925.024.425.528.629 630 635.745.941.443 046147.459.068.653.058.060.664.669.768.266.969.767.965670.55.1253.33.54.66.58,19.29.711.013.113.112.412.413.214.314.113.613 514.012 314.214.715.315.716.317.417 217.518.418.418.719.621022 325.541.151.145148 748.353.562.852.551.852.157.659.262.763.765.769.270 872.3-0.12.1.3.41.1-.1-.4-.4.0-1.81.7-.9.812.9- 62-.56.8.0.4.3.6.6_ 81.0_ 1.7.1.1014.93.4-1.634-2 4.6.44.1.5.3.4.43.23.95.43.91.015-3.97.7446.36.97.810.011.612.313.114.517.018.818.019.522.322.821.521.822.222.723.725.827.227.428.630.331.631.833.736.538.239.542.144.447 452.365.672.275.983.190.3100.8118.697.498.8100.1106.9114.2116.3119.6124.2'Cash marketing receipts and inventory changes plus Government payments, o<strong>the</strong>r farm cash income, and nonmoney incomefurnished by farms.2 Physical changes in end-<strong>of</strong>-period inventory <strong>of</strong> crop and livestock commodities valued at average prices during <strong>the</strong> period.3 Income in current dollars divided by <strong>the</strong> consumer price index (Department <strong>of</strong> Labor).Source: Department <strong>of</strong> Agriculture, except as noted.127.2129.9132.96.2264.44.56.59.911.711.712.315.115.417712.813.615 915.013 012.411311.311113.210.711.512.012.111.810.512.914.012.312.314.314.214 618.733.326.124.518 717.826.131.022.324.726.231.131.332.830.329.925.923.421.812.06610610.714.720 222.722 222.825.823.024.517.918.920 518.816 215.414113.813115.212.313 012.313 312.811313.714.412.311813.012 212114.925.117.715 21109.813.314.211.812.813.215.415.115.313.713.110.9968.8337
- Page 3:
Economic Reportof the PresidentTran
- Page 7:
ECONOMIC REPORTOF THE PRESIDENT
- Page 10 and 11:
We have heard much about American i
- Page 12 and 13:
at an approach that took account of
- Page 14 and 15:
een due to overall demand in the ec
- Page 16 and 17:
to $27.5 billion in the new budget
- Page 18 and 19:
ductions would amount to over $27 b
- Page 20 and 21:
10 percent inflation rate, keeping
- Page 22 and 23:
tutes for petroleum. The Synthetic
- Page 24 and 25:
esponse can be so large as to wipe
- Page 27:
THE ANNUAL REPORTOF THECOUNCIL OF E
- Page 31 and 32:
CONTENTSCHAPTER 1. INFLATION AND GR
- Page 33 and 34:
PageChallenges to the International
- Page 35 and 36:
CHAPTER 1Inflation and Growth in th
- Page 37 and 38:
needed to control inflation by resi
- Page 39 and 40:
decline in productivity growth may
- Page 41 and 42:
Chart 1Standard Unit Labor CostsPER
- Page 43 and 44:
end of 1974 the world price of oil
- Page 45 and 46:
price decisions cannot easily be re
- Page 47 and 48:
Federal budget achieved a surplus.
- Page 49 and 50:
As an abrupt increase in the price
- Page 51 and 52:
policies but are based on the wides
- Page 53 and 54:
tion, and can policies be designed
- Page 55 and 56:
duction and employment to grow only
- Page 57 and 58:
Moreover, their actions must indica
- Page 59 and 60:
Starting with its 1975 targets as a
- Page 61 and 62:
well after the fact whether the mon
- Page 63 and 64:
Reserve provides some flexibility i
- Page 65 and 66:
in response to circumstances in par
- Page 67 and 68:
Although the flexibility of TIPs ma
- Page 69 and 70:
ard or that thought the administrat
- Page 71 and 72:
given standard, as the reward and t
- Page 73 and 74:
large firms. Even among large firms
- Page 75 and 76:
cause declining productivity growth
- Page 77 and 78:
vanced technology and will therefor
- Page 79 and 80:
ather than restoring the growth of
- Page 81 and 82:
correct some of the distortions in
- Page 83 and 84:
higher than it would otherwise be b
- Page 85 and 86:
EXPECTED PRODUCTIVITY GAINSAlthough
- Page 87 and 88:
supply of adult men in the work for
- Page 89 and 90:
increase demand pressures, especial
- Page 91 and 92:
time hours also has drawbacks. For
- Page 93 and 94:
eintroduce the problem of changing
- Page 95 and 96:
CHAPTER 2Improving the Adaptability
- Page 97 and 98:
use less and produce more energy in
- Page 99 and 100:
expectation of price controls or fu
- Page 101 and 102:
dependence on foreign oil mean that
- Page 103 and 104:
While the market solution might pro
- Page 105 and 106:
High energy prices and excessive de
- Page 107 and 108:
part, the interests of these partie
- Page 109 and 110:
Federal regulations designed to pro
- Page 111 and 112:
Agency (EPA) from considering prosp
- Page 113 and 114:
other things, that federally assist
- Page 115 and 116:
ing services. Money-market mutual f
- Page 117 and 118:
holdings of consumer and business l
- Page 119 and 120:
they once had and thus cannot conti
- Page 121 and 122:
finding ways around outdated regula
- Page 123 and 124:
proportion of the existing farms pr
- Page 125 and 126:
prices for years in the future, reg
- Page 127 and 128:
derground water resources once thou
- Page 129 and 130:
comprehensive, actuarial crop insur
- Page 131 and 132:
duced a decline in the median age o
- Page 133 and 134:
elude government investments in loc
- Page 135 and 136:
some of the firms in the chosen sec
- Page 137 and 138:
CHAPTER 3The Economy: Review and Pr
- Page 139 and 140:
uild up oil inventories and maintai
- Page 141 and 142:
Chart 7Selected Interest Ratesand B
- Page 143 and 144:
had risen just 2 months earlier. By
- Page 145 and 146:
Chart 8Personal Saving RatePERCENT1
- Page 147 and 148:
chief cyclical determinant of housi
- Page 149 and 150:
ment were sharply diminished by the
- Page 151 and 152:
dropped even faster, in large part
- Page 153 and 154:
ployment grew more vigorously after
- Page 155 and 156:
terials fell for a full third of th
- Page 157 and 158:
1979, slowed to a 19 percent annual
- Page 159 and 160:
costs of production. The evidence s
- Page 161 and 162:
sharp decline in output in the seco
- Page 163 and 164:
ecord high interest rates during th
- Page 165 and 166:
automatic transfer services (ATS) n
- Page 167 and 168:
plunged in March, although the only
- Page 169 and 170:
(FHLB) System increased their borro
- Page 171 and 172:
THE PROSPECTS FOR 1981 AND 1982In 1
- Page 173 and 174:
expectations. Of course, if the eco
- Page 175 and 176:
The uncertainty of developments in
- Page 177 and 178:
produce a slight decline in the sav
- Page 179 and 180:
more rapid growth thereafter. Durin
- Page 181 and 182:
eemergence of modest but sustained
- Page 183 and 184:
hike would depend on many factors,
- Page 185 and 186:
major revision of the NIPA occurred
- Page 187 and 188:
per year. This modest acceleration
- Page 189 and 190:
THE INDUSTRIAL ECONOMIES: TRENDS AN
- Page 191 and 192:
Chart 10Labor Costs, Value-Added De
- Page 193 and 194:
Rather, the German current account
- Page 195 and 196:
TABLE 30.—Inflation in major indu
- Page 197 and 198:
THE GLOBAL OIL MARKETTable 31 summa
- Page 199 and 200:
may be preserved. Stocks are in fac
- Page 201 and 202:
straint on growth. Finally, policie
- Page 203 and 204:
outside government, both at home an
- Page 205 and 206:
ates are high, differences in polic
- Page 207 and 208:
Japanese trade performance in volum
- Page 209 and 210:
No "Say's Law" operates in internat
- Page 211 and 212:
the cost of the loans, and they may
- Page 213 and 214:
At the same time, access to the IMF
- Page 215 and 216:
to closer cooperation is to risk a
- Page 217 and 218:
While all countries, in attempting
- Page 219:
threats of disruption, market-shari
- Page 223:
LETTER OF TRANSMITTALCOUNCIL OF ECO
- Page 226 and 227:
Past Council Members and their date
- Page 228 and 229:
1977 to review selected analyses of
- Page 230 and 231:
The Chairman and the Council Member
- Page 232 and 233:
University). Kate Stith Pressman, s
- Page 235 and 236:
CONTENTSNATIONAL INCOME OR EXPENDIT
- Page 237 and 238:
GOVERNMENT FINANCE'—ContinuedB-72
- Page 239 and 240:
NATIONAL INCOME OR EXPENDITURETABLE
- Page 241 and 242:
TABLE B-2.—Gross national product
- Page 243 and 244:
TABLE B-3.—Implicit price deflato
- Page 245 and 246:
TABLE B-5.—Implicit price deflato
- Page 247 and 248:
TABLE B-7.—Gross national product
- Page 249 and 250:
TABLE B-8.—Gross national product
- Page 251 and 252:
TABLE B-10.—Gross national produc
- Page 253 and 254:
TABLE B-12.—Output, costs, and pr
- Page 255 and 256:
TABLE B-14.—Gross private domesti
- Page 257 and 258:
TABLE B-16.—Inventories and final
- Page 259 and 260:
TABLE B-18.—Relation of national
- Page 261 and 262:
TABLE B-19-—National income by ty
- Page 263 and 264:
Year orquarter192919331939194019411
- Page 265 and 266:
TABLE B-22.—Total and per capita
- Page 267 and 268:
Year orquarterTotalTotalCurrencyand
- Page 269 and 270:
TABLE B-26.—Population by age gro
- Page 271 and 272:
TABLE B-27.—Noninstitutional popu
- Page 273 and 274:
Year or monthTABLE B-29.—Selected
- Page 275 and 276:
TABLE B-31.—Unemployment rate by
- Page 277 and 278:
TABLE B-33.—Unemployment by reaso
- Page 279 and 280:
TABLE B-35.—Wage and salary worke
- Page 281 and 282:
TABLE B-37.—Average weekly earnin
- Page 283 and 284:
TABLE B-39.—Changes in productivi
- Page 286 and 287:
TABLE B-42.—Industrial production
- Page 288 and 289:
TABLE B-44;—New construction acti
- Page 290 and 291:
TABLE B-45.—New housing units sta
- Page 292 and 293: TABLE B-47.—Sales and inventories
- Page 294 and 295: TABLE B-49.—Manufacturers' new an
- Page 296 and 297: TABLE B-51.—Consumer price indexe
- Page 298 and 299: 19391940194119421943194419451946194
- Page 300 and 301: TABLE B-54.—Changes in special co
- Page 302 and 303: TABLE B-55.—Producer price indexe
- Page 304 and 305: TABLE B-57.—Producer price indexe
- Page 306 and 307: TABLE B-58.—Changes in producer p
- Page 308 and 309: TABLE B-60.—Components of money s
- Page 310 and 311: TABLE B-62.— Total funds raised i
- Page 312 and 313: TABLE B-63.—Federal Reserve Bank
- Page 314 and 315: TABLE B-65.—Bond yields and inter
- Page 316 and 317: TABLE B-66—Consumer credit outsta
- Page 318 and 319: TABLE B-68.—Mortgage debt outstan
- Page 320 and 321: GOVERNMENT FINANCETABLE B-70.—Fed
- Page 322 and 323: TABLE B-l\.—Federal budget receip
- Page 324 and 325: TABLE B-73.—Government receipts a
- Page 326 and 327: TABLE B-75.—State and local gover
- Page 328 and 329: TABLE B-77,—Interest-bearing publ
- Page 330 and 331: TABLE B-79-—Maturity distribution
- Page 332 and 333: TABLE B-81.—Corporate profits by
- Page 334 and 335: TABLE B-83.—Sales, profits, and s
- Page 336 and 337: TABLE B-85.—Relation of profits a
- Page 338 and 339: TABLE B-87.—Sources and uses of f
- Page 340 and 341: TABLE B-89-—State and municipal a
- Page 344 and 345: TABLE B-93.—Farm output ami produ
- Page 346 and 347: Year or month1940194119421943194419
- Page 348 and 349: TABLE B-97.—Balance sheet of the
- Page 350 and 351: TABLE B-99— U.S. international tr
- Page 352 and 353: TABLE B-100.—U.S. merchandise exp
- Page 354 and 355: TABLE B-102.—U.S. merchandise exp
- Page 356 and 357: TABLE B-104.— World trade: Export
- Page 358 and 359: TABLE B-106.—International reserv
- Page 360 and 361: • • ' •TABLE B-108.—Industr
- Page 362 and 363: TABLE B-110.—Summary of major U.S