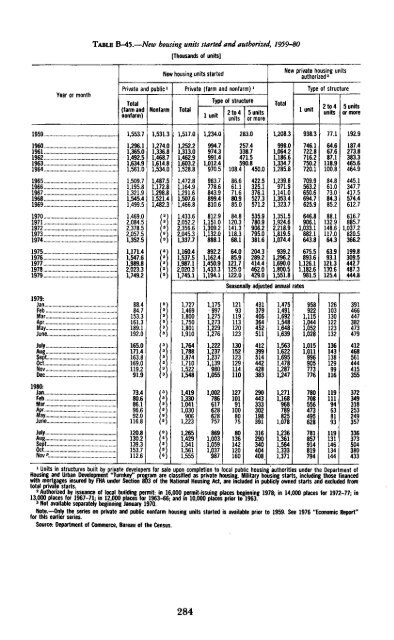
TABLE B-45.—New housing units started and authorized, 1959-80[Thousands <strong>of</strong> units]Year or monthPrivate and public 1Total(farm andnonfarm)NonfarmNew housing units startedTotalPrivate (farm and nonfarm)'1 unitType <strong>of</strong> structure2 to 4 5 unitsunits or moreTotalNew private housing unitsauthorized 21 unitType <strong>of</strong> structure2 to 4units5 units1959..1,553.71,531.31,517.01,234.0283.01,208.3938.377.1192.919601961.1962.1963.1964.1,296.11,365.01,492.51,634.91,561.01,274.01,336.81,468.71,614.81,534.01,252.21,313.01,462.91,603.21,528.8994.7974.3991.41,012.4970.5257.4338.7471.5590.8108.4 450.0998.01,064.21,186.61,334,71,285.8746.1722.8716.2750.2720.164.667.687.1118.9100.8187.4273.8383.3465.6464.91965.19661967.19681969 .1,509.71,195.81,321.91,545.41,499.51,487.51,172.81,298.81,521.41,482.31,472.81,164.91,291.61,507.61,466.8963.7778.6843.9899.4810.686.661.171.680.985.0422.5325.1376.1527.3571.21,239.8971.91,141.01,353.41,323.7709.9563.2650.6694.7625.9,84.861.073.084.385.2445.1347.7417.5574.4612.71970.19711972.19731974.,1,469.02,084.52,378.52,057.51,352.51,433.62,052.22,356.62,045.31,337.7812.91,151.01,309.21,132.0888.1120.3141.3118.368.1535.9780.9906.2795.0381.61,351.51,924.62,218.91,819.51,074.4646.8906.11,033.1882.1643.888.1132.9148.6117.064.3616.7885.71,037.2820.5366.21975197619771978..1979..1,171.41,547.61,989.82,023.31,749.21,160.41,537.51,987.12,020.31,745.1892.21,162.41,450.91,433.31,194.164.085.9121.7125.0122.0204.3289.2414.4462.0429.0939.21,296.21,690.01,800.51,551.8Seasonally adjusted annual rates675.5893.61,126.11,182.6981.563.993.1121.3130.6125.4199.8309.5442.7487.3444.81979:JanFeb..MarApr .May .June.,July . .Aug. .Sept.Oct. .Nov....Dec1980:Jan .Feb .Mar.. .AprMay....JuneJuly .Aug...Sept .Oct. .Nov....88.484.7153.3161.3189.1192.0165.0171.4163.8169.0119.291.973.480.686.196.692.0116.8120.8130.2139.3153.7112.61,7271,4691,8001,7501,8011,9101,7641,7881.8741,7101,5221,5481,4191,3301,0411,0309061,2231,2651,4291,5411,5611,5551,175•9971,2751,2731,2291,2761,2221,2371.2371,1399801,0551,0027866176286287571,0031,0591,0379871219311911312012313015212312911411012710191100801361421201604313794063644525114123995144424283832904433333021983913162903404044081,4751,4911,6921,5481,6481,6391,5631,6221,6951,4781,2871,2471,2711,1689687898251,0781 Units in structures built by private developers for sale upon completion to local public housing authorities under <strong>the</strong> Department <strong>of</strong>Housing and Urban Development "Turnkey" program are classified as private housing. Military housing starts, including those financedwith mortgages insured by FHA under Section 803 <strong>of</strong> <strong>the</strong> National Mousing Act, are included in publicly owned starts and excluded from2 Authorized by issuance <strong>of</strong> local building permit: in 16,000 permit-issuing places beginning 1978; in 14,000 places for 1972-77; in13,000 places for 1967-71; in 12,000 places for 1963-66; and in 10,000 places prior to 1963.3 Not available separately beginning January 1970.Note.—-Only <strong>the</strong> series on private and public nonfarm housing units started is available prior to 1959. See 1976 "<strong>Economic</strong> <strong>Report</strong>"for this earlier series.Source: Department <strong>of</strong> Commerce, Bureau <strong>of</strong> <strong>the</strong> Census.1,2361,3611,5641,3331,3719589221,1151,0441,0521,0281,0151,0119969057737767807085564734956287818579148197941261031301221231321361431381299911611911194638193119131146134144391466447382473479412468561444415355372349318253249357336373504380433284
TABLE B-46.—Nonfarm business expenditures for new plant and equipment, 1947-81[Billions <strong>of</strong> dollars,- quarterly data at seasonally adjusted annual rates]Plant and equipmentYear or quarterTotalPlantTotalManufacturingEnnintquipmentDurablegoodsNondurablegoodsTotalNonmanufacturir gMiningTransportationPublicutilitiesTradeandservices1Communicationando<strong>the</strong>r 21947194819491950195119521953195419551956195719581959I9601961196219631964196519661967196819*6919701971197219731974197519761977197819791980 31981 31979;tiIllIV.1980:1 ||IlIV 321.8025.4623.5425.3230.8331.5933.5833.1336.5844.7648.12421744.7848.6347 8251.2853 2561.6670.4382 2283.4288.4599.52105.61108.53120.25137.70156.98157 71171.45198 08231.24270.46294.3032613255 55265.24273.15284.30291.89294.36296.23294.951981:I 3310.59II*'ZZZZZZZ!!'..'ZZZZ 323.848.4510 3510.2010.9413.0813.1413 8214.0915.9719 3420.9419 4119.8920.94211222.1222 2324.9627 2432 2132.2235.5140.5444.2446 6049.3556.6664.2965 21712080 3192.70105.73102.58104.19106.58108.60115.96116.50117 59_13.3515.1113.3414.3717.7418.4519.7619.0320.6025.4227.1922.7624.8927.70267029.16310336.7043.1950.0151.2052.9458.9961.3661.9370.8981.0492.6992 50100.25117 77138.54164.73152.97161.04166.56175.70175.93177.86178.648.739.257.327.7311.0712.1212.4312.0012.5016.3317.5012.9813.7616.3615 5316.0317 2721.2325.41313732.2532.3436.2736.9933.6035.4242.3753.2154 9259.9569 2279.7298.68114.90131.1290.7594.71aoo.n106.57111.77115.69116.40115.37122.69130.573.393.542.673.225.125.755.715.495.878.198.596.216.728.287.437.818.6410.9813.4917.2317.8317.9319.9719.8016.7818.2222.7527.4426.3328.4734.0440.4351.0758.2566.0046.3849.2552.1355.0358.2859.3858.1957.4260.2365.365.345.714.644.515.956.376.726.516.628.158.916.777.048.088.108.228.6310.2511.9214 1514.4214.4016.3117.1916.8217.2019.6225.7628.5931.47351839.2947.6156.6565.1244.3745.4747.9751.5553.4956.3258.2157.9662.4665.2113.0716.2116.2217.5919.7619.4721.1621.1324.0828.4330.6229.1931.0232.2832 2935.2535.9940.4345.0250.8451.1856.1163.2568.6274.9384.8295.33103.78102 79111.50128 87151.52171.77179.40195.00164.80170.52173.04177.73180.13178.66179.83179.58187.90193.270.69.93.88.841.111.211.251.291.311.641.691.431.351.291261.411261.331.361421.381.441.772.022.672.883.314.626107.449 2410.2111.3813.5016.0411.2311.0111.4011.8611.8912.8113.8615.2516.0718.022.212.662.302.383.052.992.972.422.603.073.352.343.173.192.823.263.364.465.466.436.346.797.046.955.936.727.418.238.688.899.4010.6812.3511.9812.9611.4312.0212.6713.2012.4712.0912.2311.2511.5011.601.642.673.283.423.753.964.614.234.264.785.955.745.465.405.205.125.335.806.497.829.3310.5211.7013.0314.7016.2617.9719.8319 9822.3726 7929.9533.9634.62 82.2837.64. 87.8332.4034.0235.0534.0836.2635.0335.5831.9536.7836.216.136.927.138.378.838.058.949.5911.4913.6413.6814.1115.4016.1516 5318.2718 5720.3822.1324.6923.0225.3128.3129.7734.2040.0045.5347.7946 2349.3056 5468.6679.2676.0379.0378.8682.6982.1781.0781.1984.8784.0987.432.403^42.632.583.033.253 383.604.425 305.965 585.636.256 487.197 478.469.58104911.1112.0614.4316.8517.4318.9621.1223.30218023.5126 9032.0234.8337.0240.5433.7134.4435.0535.9037.3437.6636.9736.2639.4840.01:=:1 Wholesale and retail trade; finance, insurance, and real estate; and personal, business, and pr<strong>of</strong>essional services.2 "O<strong>the</strong>r" consists <strong>of</strong> construction; social services and membership organizations; and forestry, fisheries, and agricultural services.3 Planned capital expenditures reported by business in late October-December 1980, corrected for biases.Note,—Revised series; for details, see Sumy <strong>of</strong> Current Business, October 1980.Source: Department <strong>of</strong> Commerce, Bureau <strong>of</strong> <strong>Economic</strong> Analysis.285
- Page 3:
Economic Reportof the PresidentTran
- Page 7:
ECONOMIC REPORTOF THE PRESIDENT
- Page 10 and 11:
We have heard much about American i
- Page 12 and 13:
at an approach that took account of
- Page 14 and 15:
een due to overall demand in the ec
- Page 16 and 17:
to $27.5 billion in the new budget
- Page 18 and 19:
ductions would amount to over $27 b
- Page 20 and 21:
10 percent inflation rate, keeping
- Page 22 and 23:
tutes for petroleum. The Synthetic
- Page 24 and 25:
esponse can be so large as to wipe
- Page 27:
THE ANNUAL REPORTOF THECOUNCIL OF E
- Page 31 and 32:
CONTENTSCHAPTER 1. INFLATION AND GR
- Page 33 and 34:
PageChallenges to the International
- Page 35 and 36:
CHAPTER 1Inflation and Growth in th
- Page 37 and 38:
needed to control inflation by resi
- Page 39 and 40:
decline in productivity growth may
- Page 41 and 42:
Chart 1Standard Unit Labor CostsPER
- Page 43 and 44:
end of 1974 the world price of oil
- Page 45 and 46:
price decisions cannot easily be re
- Page 47 and 48:
Federal budget achieved a surplus.
- Page 49 and 50:
As an abrupt increase in the price
- Page 51 and 52:
policies but are based on the wides
- Page 53 and 54:
tion, and can policies be designed
- Page 55 and 56:
duction and employment to grow only
- Page 57 and 58:
Moreover, their actions must indica
- Page 59 and 60:
Starting with its 1975 targets as a
- Page 61 and 62:
well after the fact whether the mon
- Page 63 and 64:
Reserve provides some flexibility i
- Page 65 and 66:
in response to circumstances in par
- Page 67 and 68:
Although the flexibility of TIPs ma
- Page 69 and 70:
ard or that thought the administrat
- Page 71 and 72:
given standard, as the reward and t
- Page 73 and 74:
large firms. Even among large firms
- Page 75 and 76:
cause declining productivity growth
- Page 77 and 78:
vanced technology and will therefor
- Page 79 and 80:
ather than restoring the growth of
- Page 81 and 82:
correct some of the distortions in
- Page 83 and 84:
higher than it would otherwise be b
- Page 85 and 86:
EXPECTED PRODUCTIVITY GAINSAlthough
- Page 87 and 88:
supply of adult men in the work for
- Page 89 and 90:
increase demand pressures, especial
- Page 91 and 92:
time hours also has drawbacks. For
- Page 93 and 94:
eintroduce the problem of changing
- Page 95 and 96:
CHAPTER 2Improving the Adaptability
- Page 97 and 98:
use less and produce more energy in
- Page 99 and 100:
expectation of price controls or fu
- Page 101 and 102:
dependence on foreign oil mean that
- Page 103 and 104:
While the market solution might pro
- Page 105 and 106:
High energy prices and excessive de
- Page 107 and 108:
part, the interests of these partie
- Page 109 and 110:
Federal regulations designed to pro
- Page 111 and 112:
Agency (EPA) from considering prosp
- Page 113 and 114:
other things, that federally assist
- Page 115 and 116:
ing services. Money-market mutual f
- Page 117 and 118:
holdings of consumer and business l
- Page 119 and 120:
they once had and thus cannot conti
- Page 121 and 122:
finding ways around outdated regula
- Page 123 and 124:
proportion of the existing farms pr
- Page 125 and 126:
prices for years in the future, reg
- Page 127 and 128:
derground water resources once thou
- Page 129 and 130:
comprehensive, actuarial crop insur
- Page 131 and 132:
duced a decline in the median age o
- Page 133 and 134:
elude government investments in loc
- Page 135 and 136:
some of the firms in the chosen sec
- Page 137 and 138:
CHAPTER 3The Economy: Review and Pr
- Page 139 and 140:
uild up oil inventories and maintai
- Page 141 and 142:
Chart 7Selected Interest Ratesand B
- Page 143 and 144:
had risen just 2 months earlier. By
- Page 145 and 146:
Chart 8Personal Saving RatePERCENT1
- Page 147 and 148:
chief cyclical determinant of housi
- Page 149 and 150:
ment were sharply diminished by the
- Page 151 and 152:
dropped even faster, in large part
- Page 153 and 154:
ployment grew more vigorously after
- Page 155 and 156:
terials fell for a full third of th
- Page 157 and 158:
1979, slowed to a 19 percent annual
- Page 159 and 160:
costs of production. The evidence s
- Page 161 and 162:
sharp decline in output in the seco
- Page 163 and 164:
ecord high interest rates during th
- Page 165 and 166:
automatic transfer services (ATS) n
- Page 167 and 168:
plunged in March, although the only
- Page 169 and 170:
(FHLB) System increased their borro
- Page 171 and 172:
THE PROSPECTS FOR 1981 AND 1982In 1
- Page 173 and 174:
expectations. Of course, if the eco
- Page 175 and 176:
The uncertainty of developments in
- Page 177 and 178:
produce a slight decline in the sav
- Page 179 and 180:
more rapid growth thereafter. Durin
- Page 181 and 182:
eemergence of modest but sustained
- Page 183 and 184:
hike would depend on many factors,
- Page 185 and 186:
major revision of the NIPA occurred
- Page 187 and 188:
per year. This modest acceleration
- Page 189 and 190:
THE INDUSTRIAL ECONOMIES: TRENDS AN
- Page 191 and 192:
Chart 10Labor Costs, Value-Added De
- Page 193 and 194:
Rather, the German current account
- Page 195 and 196:
TABLE 30.—Inflation in major indu
- Page 197 and 198:
THE GLOBAL OIL MARKETTable 31 summa
- Page 199 and 200:
may be preserved. Stocks are in fac
- Page 201 and 202:
straint on growth. Finally, policie
- Page 203 and 204:
outside government, both at home an
- Page 205 and 206:
ates are high, differences in polic
- Page 207 and 208:
Japanese trade performance in volum
- Page 209 and 210:
No "Say's Law" operates in internat
- Page 211 and 212:
the cost of the loans, and they may
- Page 213 and 214:
At the same time, access to the IMF
- Page 215 and 216:
to closer cooperation is to risk a
- Page 217 and 218:
While all countries, in attempting
- Page 219:
threats of disruption, market-shari
- Page 223:
LETTER OF TRANSMITTALCOUNCIL OF ECO
- Page 226 and 227:
Past Council Members and their date
- Page 228 and 229:
1977 to review selected analyses of
- Page 230 and 231:
The Chairman and the Council Member
- Page 232 and 233:
University). Kate Stith Pressman, s
- Page 235 and 236:
CONTENTSNATIONAL INCOME OR EXPENDIT
- Page 237 and 238:
GOVERNMENT FINANCE'—ContinuedB-72
- Page 239 and 240: NATIONAL INCOME OR EXPENDITURETABLE
- Page 241 and 242: TABLE B-2.—Gross national product
- Page 243 and 244: TABLE B-3.—Implicit price deflato
- Page 245 and 246: TABLE B-5.—Implicit price deflato
- Page 247 and 248: TABLE B-7.—Gross national product
- Page 249 and 250: TABLE B-8.—Gross national product
- Page 251 and 252: TABLE B-10.—Gross national produc
- Page 253 and 254: TABLE B-12.—Output, costs, and pr
- Page 255 and 256: TABLE B-14.—Gross private domesti
- Page 257 and 258: TABLE B-16.—Inventories and final
- Page 259 and 260: TABLE B-18.—Relation of national
- Page 261 and 262: TABLE B-19-—National income by ty
- Page 263 and 264: Year orquarter192919331939194019411
- Page 265 and 266: TABLE B-22.—Total and per capita
- Page 267 and 268: Year orquarterTotalTotalCurrencyand
- Page 269 and 270: TABLE B-26.—Population by age gro
- Page 271 and 272: TABLE B-27.—Noninstitutional popu
- Page 273 and 274: Year or monthTABLE B-29.—Selected
- Page 275 and 276: TABLE B-31.—Unemployment rate by
- Page 277 and 278: TABLE B-33.—Unemployment by reaso
- Page 279 and 280: TABLE B-35.—Wage and salary worke
- Page 281 and 282: TABLE B-37.—Average weekly earnin
- Page 283 and 284: TABLE B-39.—Changes in productivi
- Page 286 and 287: TABLE B-42.—Industrial production
- Page 288 and 289: TABLE B-44;—New construction acti
- Page 292 and 293: TABLE B-47.—Sales and inventories
- Page 294 and 295: TABLE B-49.—Manufacturers' new an
- Page 296 and 297: TABLE B-51.—Consumer price indexe
- Page 298 and 299: 19391940194119421943194419451946194
- Page 300 and 301: TABLE B-54.—Changes in special co
- Page 302 and 303: TABLE B-55.—Producer price indexe
- Page 304 and 305: TABLE B-57.—Producer price indexe
- Page 306 and 307: TABLE B-58.—Changes in producer p
- Page 308 and 309: TABLE B-60.—Components of money s
- Page 310 and 311: TABLE B-62.— Total funds raised i
- Page 312 and 313: TABLE B-63.—Federal Reserve Bank
- Page 314 and 315: TABLE B-65.—Bond yields and inter
- Page 316 and 317: TABLE B-66—Consumer credit outsta
- Page 318 and 319: TABLE B-68.—Mortgage debt outstan
- Page 320 and 321: GOVERNMENT FINANCETABLE B-70.—Fed
- Page 322 and 323: TABLE B-l\.—Federal budget receip
- Page 324 and 325: TABLE B-73.—Government receipts a
- Page 326 and 327: TABLE B-75.—State and local gover
- Page 328 and 329: TABLE B-77,—Interest-bearing publ
- Page 330 and 331: TABLE B-79-—Maturity distribution
- Page 332 and 333: TABLE B-81.—Corporate profits by
- Page 334 and 335: TABLE B-83.—Sales, profits, and s
- Page 336 and 337: TABLE B-85.—Relation of profits a
- Page 338 and 339: TABLE B-87.—Sources and uses of f
- Page 340 and 341:
TABLE B-89-—State and municipal a
- Page 342 and 343:
TABLE B-91.—Business formation an
- Page 344 and 345:
TABLE B-93.—Farm output ami produ
- Page 346 and 347:
Year or month1940194119421943194419
- Page 348 and 349:
TABLE B-97.—Balance sheet of the
- Page 350 and 351:
TABLE B-99— U.S. international tr
- Page 352 and 353:
TABLE B-100.—U.S. merchandise exp
- Page 354 and 355:
TABLE B-102.—U.S. merchandise exp
- Page 356 and 357:
TABLE B-104.— World trade: Export
- Page 358 and 359:
TABLE B-106.—International reserv
- Page 360 and 361:
• • ' •TABLE B-108.—Industr
- Page 362 and 363:
TABLE B-110.—Summary of major U.S