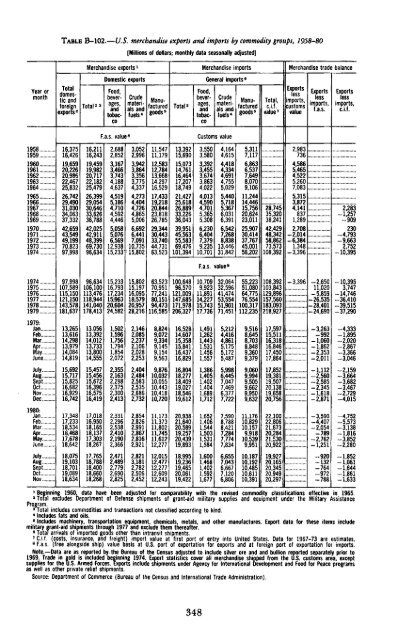
TABLE B-102.—U.S. merchandise exports and imports by commodity groups, 1958-80[Millions <strong>of</strong> dollars; monthly data seasonally adjusted]Year ormonthTotaldomesticandforeignexports 2Merchandise exports'Total 23Domestic exportsFood,beverages,andtobaccoCrudematerialsandfuels 4Food,ExportsManufacturedTotal 3 ages,bever-CrudelessExports Exportsgoods 5 materialsManufacturedci.f.Total, imports,less lessfuels*and goods 5 value 7 customsimports,valueimports,ci.f.Merchandise imports Merchandise trade balanceGeneral imports 6tobacco1958..1959..I960..1961..1962...1963...1964..1965..1966..1967..1968..1969...1970..1971...1972..,1973,.1974..16,37516,42619,65920,22620,98622,46725,83226,74229,49031,03034,06337,33242,65943,54949,19970,82397,99816,21116,24319,45919,98220,71722,18225,47926,39929,05430,64633,62636,78842,02542,91148,39969,73096,634F.a.s. value 82,6882,8523,1673,4663,7434,1884,6374,5195,1864,7104,5924,4465,0585,0766,56912,93815,2333,0522,9963,9423,8643,3563,7754,3374,2734,4044,7264,8655,0066,6926,4417,09110,73515,80211,54711,17912,58312,78413,66814.29716,52917,43319,21820,84423,81826,78529,34430,44333,74044,73163,52313,39215,69015,07314,76116,46417,20718,74921,42725,61826,88933,22636,04339,95145,56355,58369,476101,394Customs value3,5503,5803,3923,4553,6743,8634,0224,0134,5904,7015,3655,3086,2306,4047,3799,23510,7014,1644,6154,4184,3344,6914,7555,0295,4405,7185,3676,0316,3916,5427,2688,83813,44631,842F.a.s. value 85,3117,1176,8636,5377,6498,0709,10611,24414,44615,75620,62423,01125,90730,41437,76745,00156,20228,74535,32038,24142,42948,34258,86273,573108,3922,9837364,5865,4654,5225,2607,0835,3153,8724,1418371,2892,708-2,014-6,3841,348= 3,3962,283-1,257-909230-4,7939,6632,75240,395197419751976197719781979......1979:JanFebMar....AprMay....June...July....Aug..,.Sept...OdNov....Dec...1980:JanFebMar....AprMay....June...July....Aug....Sept...OctNov...,97,998107,589115,150121,150143,578181,63713,26513,61614,29813,97914,08414,81915,69215,71715,82516,68216,92916,74217,34817,23318,53418,46817,67818,64218,07519,10318,70119,08918,63496,634106,100113,476118,944141,040178,41313.05613,39214,01213,73313,80014,55515,45715,45615,67216,39616,57516,41917,01816,95018,16518,13717,30318,26717,76518,78818,40018,66018,26815,23316,79317,23415,96320,60424,5821,5021,5961,7561,7941,8542,0722,3552,1632,2982,3752,3002,4132,3312,2962,5382,4102,1902,3662,4712,4892,7792,6902,82515,80215,19716,09518,57920,95728,2162,1462,0852,2372,1062,0282,2532,4042,4842,5832,5352,6862,7322,8542,8262,9912,8672,8162,9212,8213,1812,7822,5062,45263,52370,95177,24180,15194,473116,5858,8249,0729,3349,1459,1549,5639,87610,03210,05510,44310,41810,72011,17311,37311,80211,74511,61212,27712,01512,47712,27712,60912,243100,64896,570121,009147,685171,978206,32716,52814,60715,35815,84116,43716,82916,80418,27718,40919,02718,54619,61220,93821,64020,58919,25720,43919,89318,99519,23619,46520,06119,42210,7099,92311,89114,22715,74317,7361,4911,2621,4431,5311,4561,5571,3861,4051,4021,4041,6891,7121,6521,4061,5441,5031,5311,5841.6001,4681,4021.5921,67732,06432.59641,47453,55451,90171,4515,2124,4164,8615,1755,1725,4875,9986,4457,0477,4696,3777,7227,5908,7888,4217,2847,7747,8346,6557,0436,6677,1206,80655,22351,08064,77576,554100,317112,2359,5168,6458,7038,8489,3609,3799,0609,9949,5059,6629,9509,63211,17610,82910,1579,91810,5399,95110,18710,19210,48510,61110,391108,392103,843129,896157,560183,093218,92717,59715,51116,31816,84617,45017,86417,85219,38119,50720,13819,65820,75622,10022,80621,67320,28421,53020,92219,92720,16520,34520,94920,297;-3,396 =-2,65011,020-5,859-26,535-28,401-24,690-3,263-992-1,060= 1,862-2,353-2,011-1,112-2,560=2,585-2,345-1,618-2,871-3,590-4,407= 2,054-789^2,762-1,251-920-132-764-972-788^10,3953,747= 14,746= 36,410=-39,515=37,290=4,333= 1,895= 2,020=2,867=3,366= 3,046-2,159= 3,664= 3,682-3,467=2,729=4,015=4,752= 5,573= 3,138= 1,816-3,852=2,280= 1,852= 1,061= 1,644-1,861= 1,6331 Beginning 1960, data have been adjusted for comparability with <strong>the</strong> revised commodity classifications effective in 1965.2 Total excludes Department <strong>of</strong> Defense shipments <strong>of</strong> grant-aid military supplies and equipment under <strong>the</strong> Military AssistanceProgram." Total includes commodities and transactions not classified according to kind.4 Includes fats and oils.8 Includes machinery, transportation equipment, chemicals, metals, and o<strong>the</strong>r manufactures. Export data for <strong>the</strong>se items includemilitary grant-aid shipments through 1977 and exclude <strong>the</strong>m <strong>the</strong>reafter.8 Total arrivals <strong>of</strong> imported goods o<strong>the</strong>r than intransit shipments.7 Ci.f. (costs, insurance, and freight) import value at first port <strong>of</strong> entry into United States. Data for 1967-73 are estimates.8 F.a.s. (free alongside ship) value basis at U.S. port <strong>of</strong> exportation for exports and at foreign port <strong>of</strong> exportation for imports.Note.—Data are as reported by <strong>the</strong> Bureau <strong>of</strong> <strong>the</strong> Census adjusted to include silver ore and and bullion reported separately prior to1969. Trade in gold is included beginning 1974. Export statistics cover all merchandise shipped from <strong>the</strong> U.S. customs area, exceptsupplies for <strong>the</strong> U.S. Armed Forces. Exports include shipments under Agency for International Development and Food for Peace programsas well as o<strong>the</strong>r private relief shipments.Source: Department <strong>of</strong> Commerce (Bureau <strong>of</strong> <strong>the</strong> Census and International Trade Administration).348
TABLE B-103.—International investment position <strong>of</strong> <strong>the</strong> United States at year-end, selected years, 1970-79[Billions <strong>of</strong> dollars]Type <strong>of</strong> investment 1970 1972 1974 1976 1977 1978 1979Net international investment position <strong>of</strong> <strong>the</strong> United States..U.S. assets abroadU.S. <strong>of</strong>ficial reserve assets.Gold..Special drawing rights (SDRs)Reserve position in <strong>the</strong> International Monetary Fund (IMF). ...Foreign currency reservesO<strong>the</strong>r U.S. Government assets..U.S. loans and o<strong>the</strong>r long-term assetsU.S. short-term assets o<strong>the</strong>r than reservesU.S. private assetsDirect investments abroad (book value)Foreign securitiesClaims on foreigners reported by U.S. banks, not included elsewhereClaims on unaffiliated foreigners reported by U.S. nonbanks..... . ..Foreign assets in <strong>the</strong> United StatesForeign <strong>of</strong>ficial assetsU.S. Government securities lO<strong>the</strong>r U.S. Government liabilitiesLiabilities reported by U.S. banks, not included elsewhere...O<strong>the</strong>r <strong>of</strong>ficial assetsO<strong>the</strong>r foreign assets....Direct investments in <strong>the</strong> United States (book value)Liabilities reported by U.S. banks, not included elsewhereU.S. Treasury securitiesO<strong>the</strong>r U.S. securities 2Liabilities to unaffiliated foreigners reported by U.S. nonbanks58.6165.514.511.1.91.9.632.129.72.5118.875.521.013.88.5106.826.117.71.76.7.080.713.322.71.234.737.1199.013.210.52.0.5.236.134.12.0149.789.927.620.711.4161.863.252.91.68.5.298.714.921.21.250.710.758.8255.715.911.72.41.9.038.436.32.1201.5*110.128.246.217.0196.979.858.12.618.4.6117.125.141.81.734.913.682.5347.218.711.62.44.4.346.044.11.9282.4136.844.281,120.3264.7105.674.08.8.17.25.6159.130.853.57.054.813.072.3383.019.311.72,64.9.049.647.81.8314.1149.849.492.622.3310.6141.9106.89.918.07.2168.734.660.27.652.913.475.3450.918.711.71.61.04.454.2. 52.31.9378.0167.853.4130.726.1375,5174.8130.912.223.38.5200742.577.99.955.415.195.0513.218.911.22.71.33.858.556.51.9435.8192.656.7156.629.9418.2160.3108.311.530.510.1257.952.3110.515.061.918.21 Includes Treasury and agency issues <strong>of</strong> securities.2 Corporate and o<strong>the</strong>r bonds and corporate stocks.Note,—Gold is valued at SDR35 per ounce, throughout The SDR value is converted to dollars at $1/SDR before December 1971, at$1.08571/SDR from December 1971 through January 1973, at $1.20635/SDR from February 1973 through June 1974, and as measuredby <strong>the</strong> basket vafuation <strong>of</strong> <strong>the</strong> SDR beginning July 1974.Source: Department <strong>of</strong> Commerce, Bureau <strong>of</strong> <strong>Economic</strong> Analysis.349
- Page 3:
Economic Reportof the PresidentTran
- Page 7:
ECONOMIC REPORTOF THE PRESIDENT
- Page 10 and 11:
We have heard much about American i
- Page 12 and 13:
at an approach that took account of
- Page 14 and 15:
een due to overall demand in the ec
- Page 16 and 17:
to $27.5 billion in the new budget
- Page 18 and 19:
ductions would amount to over $27 b
- Page 20 and 21:
10 percent inflation rate, keeping
- Page 22 and 23:
tutes for petroleum. The Synthetic
- Page 24 and 25:
esponse can be so large as to wipe
- Page 27:
THE ANNUAL REPORTOF THECOUNCIL OF E
- Page 31 and 32:
CONTENTSCHAPTER 1. INFLATION AND GR
- Page 33 and 34:
PageChallenges to the International
- Page 35 and 36:
CHAPTER 1Inflation and Growth in th
- Page 37 and 38:
needed to control inflation by resi
- Page 39 and 40:
decline in productivity growth may
- Page 41 and 42:
Chart 1Standard Unit Labor CostsPER
- Page 43 and 44:
end of 1974 the world price of oil
- Page 45 and 46:
price decisions cannot easily be re
- Page 47 and 48:
Federal budget achieved a surplus.
- Page 49 and 50:
As an abrupt increase in the price
- Page 51 and 52:
policies but are based on the wides
- Page 53 and 54:
tion, and can policies be designed
- Page 55 and 56:
duction and employment to grow only
- Page 57 and 58:
Moreover, their actions must indica
- Page 59 and 60:
Starting with its 1975 targets as a
- Page 61 and 62:
well after the fact whether the mon
- Page 63 and 64:
Reserve provides some flexibility i
- Page 65 and 66:
in response to circumstances in par
- Page 67 and 68:
Although the flexibility of TIPs ma
- Page 69 and 70:
ard or that thought the administrat
- Page 71 and 72:
given standard, as the reward and t
- Page 73 and 74:
large firms. Even among large firms
- Page 75 and 76:
cause declining productivity growth
- Page 77 and 78:
vanced technology and will therefor
- Page 79 and 80:
ather than restoring the growth of
- Page 81 and 82:
correct some of the distortions in
- Page 83 and 84:
higher than it would otherwise be b
- Page 85 and 86:
EXPECTED PRODUCTIVITY GAINSAlthough
- Page 87 and 88:
supply of adult men in the work for
- Page 89 and 90:
increase demand pressures, especial
- Page 91 and 92:
time hours also has drawbacks. For
- Page 93 and 94:
eintroduce the problem of changing
- Page 95 and 96:
CHAPTER 2Improving the Adaptability
- Page 97 and 98:
use less and produce more energy in
- Page 99 and 100:
expectation of price controls or fu
- Page 101 and 102:
dependence on foreign oil mean that
- Page 103 and 104:
While the market solution might pro
- Page 105 and 106:
High energy prices and excessive de
- Page 107 and 108:
part, the interests of these partie
- Page 109 and 110:
Federal regulations designed to pro
- Page 111 and 112:
Agency (EPA) from considering prosp
- Page 113 and 114:
other things, that federally assist
- Page 115 and 116:
ing services. Money-market mutual f
- Page 117 and 118:
holdings of consumer and business l
- Page 119 and 120:
they once had and thus cannot conti
- Page 121 and 122:
finding ways around outdated regula
- Page 123 and 124:
proportion of the existing farms pr
- Page 125 and 126:
prices for years in the future, reg
- Page 127 and 128:
derground water resources once thou
- Page 129 and 130:
comprehensive, actuarial crop insur
- Page 131 and 132:
duced a decline in the median age o
- Page 133 and 134:
elude government investments in loc
- Page 135 and 136:
some of the firms in the chosen sec
- Page 137 and 138:
CHAPTER 3The Economy: Review and Pr
- Page 139 and 140:
uild up oil inventories and maintai
- Page 141 and 142:
Chart 7Selected Interest Ratesand B
- Page 143 and 144:
had risen just 2 months earlier. By
- Page 145 and 146:
Chart 8Personal Saving RatePERCENT1
- Page 147 and 148:
chief cyclical determinant of housi
- Page 149 and 150:
ment were sharply diminished by the
- Page 151 and 152:
dropped even faster, in large part
- Page 153 and 154:
ployment grew more vigorously after
- Page 155 and 156:
terials fell for a full third of th
- Page 157 and 158:
1979, slowed to a 19 percent annual
- Page 159 and 160:
costs of production. The evidence s
- Page 161 and 162:
sharp decline in output in the seco
- Page 163 and 164:
ecord high interest rates during th
- Page 165 and 166:
automatic transfer services (ATS) n
- Page 167 and 168:
plunged in March, although the only
- Page 169 and 170:
(FHLB) System increased their borro
- Page 171 and 172:
THE PROSPECTS FOR 1981 AND 1982In 1
- Page 173 and 174:
expectations. Of course, if the eco
- Page 175 and 176:
The uncertainty of developments in
- Page 177 and 178:
produce a slight decline in the sav
- Page 179 and 180:
more rapid growth thereafter. Durin
- Page 181 and 182:
eemergence of modest but sustained
- Page 183 and 184:
hike would depend on many factors,
- Page 185 and 186:
major revision of the NIPA occurred
- Page 187 and 188:
per year. This modest acceleration
- Page 189 and 190:
THE INDUSTRIAL ECONOMIES: TRENDS AN
- Page 191 and 192:
Chart 10Labor Costs, Value-Added De
- Page 193 and 194:
Rather, the German current account
- Page 195 and 196:
TABLE 30.—Inflation in major indu
- Page 197 and 198:
THE GLOBAL OIL MARKETTable 31 summa
- Page 199 and 200:
may be preserved. Stocks are in fac
- Page 201 and 202:
straint on growth. Finally, policie
- Page 203 and 204:
outside government, both at home an
- Page 205 and 206:
ates are high, differences in polic
- Page 207 and 208:
Japanese trade performance in volum
- Page 209 and 210:
No "Say's Law" operates in internat
- Page 211 and 212:
the cost of the loans, and they may
- Page 213 and 214:
At the same time, access to the IMF
- Page 215 and 216:
to closer cooperation is to risk a
- Page 217 and 218:
While all countries, in attempting
- Page 219:
threats of disruption, market-shari
- Page 223:
LETTER OF TRANSMITTALCOUNCIL OF ECO
- Page 226 and 227:
Past Council Members and their date
- Page 228 and 229:
1977 to review selected analyses of
- Page 230 and 231:
The Chairman and the Council Member
- Page 232 and 233:
University). Kate Stith Pressman, s
- Page 235 and 236:
CONTENTSNATIONAL INCOME OR EXPENDIT
- Page 237 and 238:
GOVERNMENT FINANCE'—ContinuedB-72
- Page 239 and 240:
NATIONAL INCOME OR EXPENDITURETABLE
- Page 241 and 242:
TABLE B-2.—Gross national product
- Page 243 and 244:
TABLE B-3.—Implicit price deflato
- Page 245 and 246:
TABLE B-5.—Implicit price deflato
- Page 247 and 248:
TABLE B-7.—Gross national product
- Page 249 and 250:
TABLE B-8.—Gross national product
- Page 251 and 252:
TABLE B-10.—Gross national produc
- Page 253 and 254:
TABLE B-12.—Output, costs, and pr
- Page 255 and 256:
TABLE B-14.—Gross private domesti
- Page 257 and 258:
TABLE B-16.—Inventories and final
- Page 259 and 260:
TABLE B-18.—Relation of national
- Page 261 and 262:
TABLE B-19-—National income by ty
- Page 263 and 264:
Year orquarter192919331939194019411
- Page 265 and 266:
TABLE B-22.—Total and per capita
- Page 267 and 268:
Year orquarterTotalTotalCurrencyand
- Page 269 and 270:
TABLE B-26.—Population by age gro
- Page 271 and 272:
TABLE B-27.—Noninstitutional popu
- Page 273 and 274:
Year or monthTABLE B-29.—Selected
- Page 275 and 276:
TABLE B-31.—Unemployment rate by
- Page 277 and 278:
TABLE B-33.—Unemployment by reaso
- Page 279 and 280:
TABLE B-35.—Wage and salary worke
- Page 281 and 282:
TABLE B-37.—Average weekly earnin
- Page 283 and 284:
TABLE B-39.—Changes in productivi
- Page 286 and 287:
TABLE B-42.—Industrial production
- Page 288 and 289:
TABLE B-44;—New construction acti
- Page 290 and 291:
TABLE B-45.—New housing units sta
- Page 292 and 293:
TABLE B-47.—Sales and inventories
- Page 294 and 295:
TABLE B-49.—Manufacturers' new an
- Page 296 and 297:
TABLE B-51.—Consumer price indexe
- Page 298 and 299:
19391940194119421943194419451946194
- Page 300 and 301:
TABLE B-54.—Changes in special co
- Page 302 and 303:
TABLE B-55.—Producer price indexe
- Page 304 and 305: TABLE B-57.—Producer price indexe
- Page 306 and 307: TABLE B-58.—Changes in producer p
- Page 308 and 309: TABLE B-60.—Components of money s
- Page 310 and 311: TABLE B-62.— Total funds raised i
- Page 312 and 313: TABLE B-63.—Federal Reserve Bank
- Page 314 and 315: TABLE B-65.—Bond yields and inter
- Page 316 and 317: TABLE B-66—Consumer credit outsta
- Page 318 and 319: TABLE B-68.—Mortgage debt outstan
- Page 320 and 321: GOVERNMENT FINANCETABLE B-70.—Fed
- Page 322 and 323: TABLE B-l\.—Federal budget receip
- Page 324 and 325: TABLE B-73.—Government receipts a
- Page 326 and 327: TABLE B-75.—State and local gover
- Page 328 and 329: TABLE B-77,—Interest-bearing publ
- Page 330 and 331: TABLE B-79-—Maturity distribution
- Page 332 and 333: TABLE B-81.—Corporate profits by
- Page 334 and 335: TABLE B-83.—Sales, profits, and s
- Page 336 and 337: TABLE B-85.—Relation of profits a
- Page 338 and 339: TABLE B-87.—Sources and uses of f
- Page 340 and 341: TABLE B-89-—State and municipal a
- Page 342 and 343: TABLE B-91.—Business formation an
- Page 344 and 345: TABLE B-93.—Farm output ami produ
- Page 346 and 347: Year or month1940194119421943194419
- Page 348 and 349: TABLE B-97.—Balance sheet of the
- Page 350 and 351: TABLE B-99— U.S. international tr
- Page 352 and 353: TABLE B-100.—U.S. merchandise exp
- Page 356 and 357: TABLE B-104.— World trade: Export
- Page 358 and 359: TABLE B-106.—International reserv
- Page 360 and 361: • • ' •TABLE B-108.—Industr
- Page 362 and 363: TABLE B-110.—Summary of major U.S