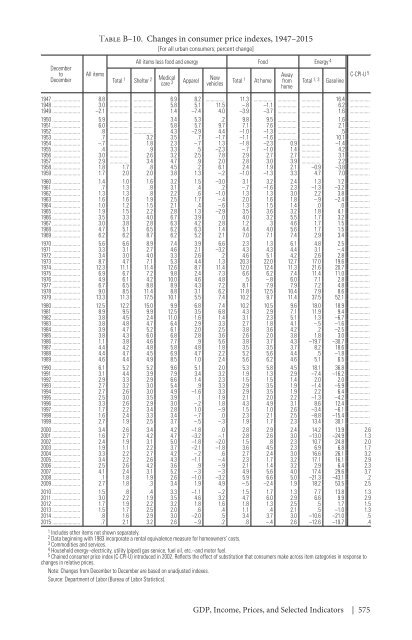
Table B–10. Changes in consumer price indexes, 1947–2015 [For all urban consumers; percent change] December to December All items All items less food and energy Food Energy 4 C-CPI-U 5 Total 1 Shelter 2 Medical care 3 Apparel New Away vehicles Total 1 At home from Total 1, 3 Gasoline home 1947 8.8 6.9 8.2 11.3 16.4 1948 3.0 5.8 5.1 11.5 –.8 –1.1 6.2 1949 –2.1 1.4 –7.4 4.0 –3.9 –3.7 1.6 1950 5.9 3.4 5.3 .2 9.8 9.5 1.6 1951 6.0 5.8 5.7 9.7 7.1 7.6 2.1 1952 .8 4.3 –2.9 4.4 –1.0 –1.3 .5 1953 .7 3.2 3.5 .7 –1.7 –1.1 –1.6 10.1 1954 –.7 1.8 2.3 –.7 1.3 –1.8 –2.3 0.9 –1.4 1955 .4 .9 3.3 .5 –2.3 –.7 –1.0 1.4 4.2 1956 3.0 2.6 3.2 2.5 7.8 2.9 2.7 2.7 3.1 1957 2.9 3.4 4.7 .9 2.0 2.8 3.0 3.9 2.2 1958 1.8 1.7 .8 4.5 .2 6.1 2.4 1.9 2.1 –0.9 –3.8 1959 1.7 2.0 2.0 3.8 1.3 –.2 –1.0 –1.3 3.3 4.7 7.0 1960 1.4 1.0 1.6 3.2 1.5 –3.0 3.1 3.2 2.4 1.3 1.2 1961 .7 1.3 .8 3.1 .4 .2 –.7 –1.6 2.3 –1.3 –3.2 1962 1.3 1.3 .8 2.2 .6 –1.0 1.3 1.3 3.0 2.2 3.8 1963 1.6 1.6 1.9 2.5 1.7 –.4 2.0 1.6 1.8 –.9 –2.4 1964 1.0 1.2 1.5 2.1 .4 –.6 1.3 1.5 1.4 .0 .0 1965 1.9 1.5 2.2 2.8 1.3 –2.9 3.5 3.6 3.2 1.8 4.1 1966 3.5 3.3 4.0 6.7 3.9 .0 4.0 3.2 5.5 1.7 3.2 1967 3.0 3.8 2.8 6.3 4.2 2.8 1.2 .3 4.6 1.7 1.5 1968 4.7 5.1 6.5 6.2 6.3 1.4 4.4 4.0 5.6 1.7 1.5 1969 6.2 6.2 8.7 6.2 5.2 2.1 7.0 7.1 7.4 2.9 3.4 1970 5.6 6.6 8.9 7.4 3.9 6.6 2.3 1.3 6.1 4.8 2.5 1971 3.3 3.1 2.7 4.6 2.1 –3.2 4.3 4.3 4.4 3.1 –.4 1972 3.4 3.0 4.0 3.3 2.6 .2 4.6 5.1 4.2 2.6 2.8 1973 8.7 4.7 7.1 5.3 4.4 1.3 20.3 22.0 12.7 17.0 19.6 1974 12.3 11.1 11.4 12.6 8.7 11.4 12.0 12.4 11.3 21.6 20.7 1975 6.9 6.7 7.2 9.8 2.4 7.3 6.6 6.2 7.4 11.4 11.0 1976 4.9 6.1 4.2 10.0 4.6 4.8 .5 –.8 6.0 7.1 2.8 1977 6.7 6.5 8.8 8.9 4.3 7.2 8.1 7.9 7.9 7.2 4.8 1978 9.0 8.5 11.4 8.8 3.1 6.2 11.8 12.5 10.4 7.9 8.6 1979 13.3 11.3 17.5 10.1 5.5 7.4 10.2 9.7 11.4 37.5 52.1 1980 12.5 12.2 15.0 9.9 6.8 7.4 10.2 10.5 9.6 18.0 18.9 1981 8.9 9.5 9.9 12.5 3.5 6.8 4.3 2.9 7.1 11.9 9.4 1982 3.8 4.5 2.4 11.0 1.6 1.4 3.1 2.3 5.1 1.3 –6.7 1983 3.8 4.8 4.7 6.4 2.9 3.3 2.7 1.8 4.1 –.5 –1.6 1984 3.9 4.7 5.2 6.1 2.0 2.5 3.8 3.6 4.2 .2 –2.5 1985 3.8 4.3 6.0 6.8 2.8 3.6 2.6 2.0 3.8 1.8 3.0 1986 1.1 3.8 4.6 7.7 .9 5.6 3.8 3.7 4.3 –19.7 –30.7 1987 4.4 4.2 4.8 5.8 4.8 1.8 3.5 3.5 3.7 8.2 18.6 1988 4.4 4.7 4.5 6.9 4.7 2.2 5.2 5.6 4.4 .5 –1.8 1989 4.6 4.4 4.9 8.5 1.0 2.4 5.6 6.2 4.6 5.1 6.5 1990 6.1 5.2 5.2 9.6 5.1 2.0 5.3 5.8 4.5 18.1 36.8 1991 3.1 4.4 3.9 7.9 3.4 3.2 1.9 1.3 2.9 –7.4 –16.2 1992 2.9 3.3 2.9 6.6 1.4 2.3 1.5 1.5 1.4 2.0 2.0 1993 2.7 3.2 3.0 5.4 .9 3.3 2.9 3.5 1.9 –1.4 –5.9 1994 2.7 2.6 3.0 4.9 –1.6 3.3 2.9 3.5 1.9 2.2 6.4 1995 2.5 3.0 3.5 3.9 .1 1.9 2.1 2.0 2.2 –1.3 –4.2 1996 3.3 2.6 2.9 3.0 –.2 1.8 4.3 4.9 3.1 8.6 12.4 1997 1.7 2.2 3.4 2.8 1.0 –.9 1.5 1.0 2.6 –3.4 –6.1 1998 1.6 2.4 3.3 3.4 –.7 .0 2.3 2.1 2.5 –8.8 –15.4 1999 2.7 1.9 2.5 3.7 –.5 –.3 1.9 1.7 2.3 13.4 30.1 2000 3.4 2.6 3.4 4.2 –1.8 .0 2.8 2.9 2.4 14.2 13.9 2.6 2001 1.6 2.7 4.2 4.7 –3.2 –.1 2.8 2.6 3.0 –13.0 –24.9 1.3 2002 2.4 1.9 3.1 5.0 –1.8 –2.0 1.5 .8 2.3 10.7 24.8 2.0 2003 1.9 1.1 2.2 3.7 –2.1 –1.8 3.6 4.5 2.3 6.9 6.8 1.7 2004 3.3 2.2 2.7 4.2 –.2 .6 2.7 2.4 3.0 16.6 26.1 3.2 2005 3.4 2.2 2.6 4.3 –1.1 –.4 2.3 1.7 3.2 17.1 16.1 2.9 2006 2.5 2.6 4.2 3.6 .9 –.9 2.1 1.4 3.2 2.9 6.4 2.3 2007 4.1 2.4 3.1 5.2 –.3 –.3 4.9 5.6 4.0 17.4 29.6 3.7 2008 .1 1.8 1.9 2.6 –1.0 –3.2 5.9 6.6 5.0 –21.3 –43.1 .2 2009 2.7 1.8 .3 3.4 1.9 4.9 –.5 –2.4 1.9 18.2 53.5 2.5 2010 1.5 .8 .4 3.3 –1.1 –.2 1.5 1.7 1.3 7.7 13.8 1.3 2011 3.0 2.2 1.9 3.5 4.6 3.2 4.7 6.0 2.9 6.6 9.9 2.9 2012 1.7 1.9 2.2 3.2 1.8 1.6 1.8 1.3 2.5 .5 1.7 1.5 2013 1.5 1.7 2.5 2.0 .6 .4 1.1 .4 2.1 .5 –1.0 1.3 2014 .8 1.6 2.9 3.0 –2.0 .5 3.4 3.7 3.0 –10.6 –21.0 .5 2015 .7 2.1 3.2 2.6 –.9 .2 .8 –.4 2.6 –12.6 –19.7 .4 1 Includes other items not shown separately. 2 Data beginning with 1983 incorporate a rental equivalence measure for homeowners’ costs. 3 Commodities and services. 4 Household energy--electricity, utility (piped) gas service, fuel oil, etc.--and motor fuel. 5 Chained consumer price index (C-CPI-U) introduced in 2002. Reflects the effect of substitution that consumers make across item categories in response to changes in relative prices. Note: Changes from December to December are based on unadjusted indexes. Source: Department of Labor (Bureau of Labor Statistics). GDP, Income, Prices, and Selected Indicators | 575
Labor Market Indicators Table B–11. Civilian labor force, 1929–2016 [Monthly data seasonally adjusted, except as noted] Year or month Civilian noninstitutional population 1 Total Total Civilian labor force Employment Agricultural Unemployment Nonagricultural Not in labor force Civilian labor force participation rate 2 Civilian employment/ population ratio 3 Unemployment rate, civilian workers 4 Thousands of persons 14 years of age and over 1929 49,180 47,630 10,450 37,180 1,550 3.2 1930 49,820 45,480 10,340 35,140 4,340 8.7 1931 50,420 42,400 10,290 32,110 8,020 15.9 1932 51,000 38,940 10,170 28,770 12,060 23.6 1933 51,590 38,760 10,090 28,670 12,830 24.9 1934 52,230 40,890 9,900 30,990 11,340 21.7 1935 52,870 42,260 10,110 32,150 10,610 20.1 1936 53,440 44,410 10,000 34,410 9,030 16.9 1937 54,000 46,300 9,820 36,480 7,700 14.3 1938 54,610 44,220 9,690 34,530 10,390 19.0 1939 55,230 45,750 9,610 36,140 9,480 17.2 1940 99,840 55,640 47,520 9,540 37,980 8,120 44,200 55.7 47.6 14.6 1941 99,900 55,910 50,350 9,100 41,250 5,560 43,990 56.0 50.4 9.9 1942 98,640 56,410 53,750 9,250 44,500 2,660 42,230 57.2 54.5 4.7 1943 94,640 55,540 54,470 9,080 45,390 1,070 39,100 58.7 57.6 1.9 1944 93,220 54,630 53,960 8,950 45,010 670 38,590 58.6 57.9 1.2 1945 94,090 53,860 52,820 8,580 44,240 1,040 40,230 57.2 56.1 1.9 1946 103,070 57,520 55,250 8,320 46,930 2,270 45,550 55.8 53.6 3.9 1947 106,018 60,168 57,812 8,256 49,557 2,356 45,850 56.8 54.5 3.9 Thousands of persons 16 years of age and over 1947 101,827 59,350 57,038 7,890 49,148 2,311 42,477 58.3 56.0 3.9 1948 103,068 60,621 58,343 7,629 50,714 2,276 42,447 58.8 56.6 3.8 1949 103,994 61,286 57,651 7,658 49,993 3,637 42,708 58.9 55.4 5.9 1950 104,995 62,208 58,918 7,160 51,758 3,288 42,787 59.2 56.1 5.3 1951 104,621 62,017 59,961 6,726 53,235 2,055 42,604 59.2 57.3 3.3 1952 105,231 62,138 60,250 6,500 53,749 1,883 43,093 59.0 57.3 3.0 1953 107,056 63,015 61,179 6,260 54,919 1,834 44,041 58.9 57.1 2.9 1954 108,321 63,643 60,109 6,205 53,904 3,532 44,678 58.8 55.5 5.5 1955 109,683 65,023 62,170 6,450 55,722 2,852 44,660 59.3 56.7 4.4 1956 110,954 66,552 63,799 6,283 57,514 2,750 44,402 60.0 57.5 4.1 1957 112,265 66,929 64,071 5,947 58,123 2,859 45,336 59.6 57.1 4.3 1958 113,727 67,639 63,036 5,586 57,450 4,602 46,088 59.5 55.4 6.8 1959 115,329 68,369 64,630 5,565 59,065 3,740 46,960 59.3 56.0 5.5 1960 117,245 69,628 65,778 5,458 60,318 3,852 47,617 59.4 56.1 5.5 1961 118,771 70,459 65,746 5,200 60,546 4,714 48,312 59.3 55.4 6.7 1962 120,153 70,614 66,702 4,944 61,759 3,911 49,539 58.8 55.5 5.5 1963 122,416 71,833 67,762 4,687 63,076 4,070 50,583 58.7 55.4 5.7 1964 124,485 73,091 69,305 4,523 64,782 3,786 51,394 58.7 55.7 5.2 1965 126,513 74,455 71,088 4,361 66,726 3,366 52,058 58.9 56.2 4.5 1966 128,058 75,770 72,895 3,979 68,915 2,875 52,288 59.2 56.9 3.8 1967 129,874 77,347 74,372 3,844 70,527 2,975 52,527 59.6 57.3 3.8 1968 132,028 78,737 75,920 3,817 72,103 2,817 53,291 59.6 57.5 3.6 1969 134,335 80,734 77,902 3,606 74,296 2,832 53,602 60.1 58.0 3.5 1970 137,085 82,771 78,678 3,463 75,215 4,093 54,315 60.4 57.4 4.9 1971 140,216 84,382 79,367 3,394 75,972 5,016 55,834 60.2 56.6 5.9 1972 144,126 87,034 82,153 3,484 78,669 4,882 57,091 60.4 57.0 5.6 1973 147,096 89,429 85,064 3,470 81,594 4,365 57,667 60.8 57.8 4.9 1974 150,120 91,949 86,794 3,515 83,279 5,156 58,171 61.3 57.8 5.6 1975 153,153 93,775 85,846 3,408 82,438 7,929 59,377 61.2 56.1 8.5 1976 156,150 96,158 88,752 3,331 85,421 7,406 59,991 61.6 56.8 7.7 1977 159,033 99,009 92,017 3,283 88,734 6,991 60,025 62.3 57.9 7.1 1978 161,910 102,251 96,048 3,387 92,661 6,202 59,659 63.2 59.3 6.1 1979 164,863 104,962 98,824 3,347 95,477 6,137 59,900 63.7 59.9 5.8 1980 167,745 106,940 99,303 3,364 95,938 7,637 60,806 63.8 59.2 7.1 1981 170,130 108,670 100,397 3,368 97,030 8,273 61,460 63.9 59.0 7.6 1982 172,271 110,204 99,526 3,401 96,125 10,678 62,067 64.0 57.8 9.7 1983 174,215 111,550 100,834 3,383 97,450 10,717 62,665 64.0 57.9 9.6 1984 176,383 113,544 105,005 3,321 101,685 8,539 62,839 64.4 59.5 7.5 1985 178,206 115,461 107,150 3,179 103,971 8,312 62,744 64.8 60.1 7.2 1986 180,587 117,834 109,597 3,163 106,434 8,237 62,752 65.3 60.7 7.0 1987 182,753 119,865 112,440 3,208 109,232 7,425 62,888 65.6 61.5 6.2 1988 184,613 121,669 114,968 3,169 111,800 6,701 62,944 65.9 62.3 5.5 1989 186,393 123,869 117,342 3,199 114,142 6,528 62,523 66.5 63.0 5.3 1 Not seasonally adjusted. 2 Civilian labor force as percent of civilian noninstitutional population. 3 Civilian employment as percent of civilian noninstitutional population. 4 Unemployed as percent of civilian labor force. See next page for continuation of table. Percent 576 | Appendix B
- Page 1 and 2:
ECONOMIC REPORT OF THE PRESIDENT To
- Page 4:
C O N T E N T S ECONOMIC REPORT OF
- Page 8 and 9:
economic report of the president To
- Page 10 and 11:
eforms in history. Banks have sharp
- Page 12:
the annual report of the council of
- Page 16 and 17:
C O N T E N T S CHAPTER 1: EIGHT YE
- Page 18 and 19:
. THE ECONOMIC RATIONALE FOR FEDERA
- Page 20 and 21:
2.4. Government Purchases as Share
- Page 22 and 23:
4.iii. Premium for the Benchmark Pl
- Page 24 and 25:
6.18. Systemic Risk (SRISK) 2005-20
- Page 26 and 27:
C H A P T E R 1 EIGHT YEARS OF RECO
- Page 28 and 29:
Figure 1-1 Actual and Consensus For
- Page 30 and 31:
Figure 1-3 Real Hourly Wage Growth
- Page 32 and 33:
Figure 1-4 Real GDP per Capita: Eur
- Page 34 and 35:
Figure 1-6 Household Net Worth in t
- Page 36 and 37:
Figure 1-8 Global Trade Flows in th
- Page 38 and 39:
Subsequent revisions to fourth-quar
- Page 40 and 41:
Percent 6 Figure 1-9 Fiscal Expansi
- Page 42 and 43:
substantial costs to the Federal Go
- Page 44 and 45:
worked to promote innovation and in
- Page 46 and 47:
expansion, a period of low producti
- Page 48 and 49:
The 2017 Economic Report of the Pre
- Page 50 and 51:
Chapter 4: Reforming the Health Car
- Page 52 and 53:
to the ACA and other factors. The A
- Page 54 and 55:
than 98 percent of Americans should
- Page 56 and 57:
Figure 1-13 Borrowers in Income Dri
- Page 58 and 59:
success of the financial rescue and
- Page 60 and 61:
einforced U.S. leadership in the ru
- Page 62 and 63:
Partnership (OGP), a global partner
- Page 64 and 65:
Figure 1-16 Labor Productivity Grow
- Page 66 and 67:
Labor Force Participation Household
- Page 68 and 69:
number of steps to ensure that econ
- Page 70 and 71:
C H A P T E R 2 THE YEAR IN REVIEW
- Page 72 and 73:
Percent 11 Figure 2-1 Unemployment
- Page 74 and 75:
allowing for additional investments
- Page 76 and 77:
Percentage Point 0.6 0.4 Figure 2-3
- Page 78 and 79:
public, largely highway constructio
- Page 80 and 81:
The size of the Federal Reserve’s
- Page 82 and 83:
Figure 2-5 Private-Sector Payroll E
- Page 84 and 85:
fell 80 percent from September 2014
- Page 86 and 87:
Figure 2-8 Rates of Part-Time Work,
- Page 88 and 89:
Figure 2-v Prime-Age Male Labor For
- Page 90 and 91:
Output Real GDP grew 1.6 percent ov
- Page 92 and 93:
Figure 2-11 Compensation and Consum
- Page 94 and 95:
Table 2-i Optimal Weighting for Hou
- Page 96 and 97:
esults suggest that, to a first app
- Page 98 and 99:
Figure 2-viii Real GDP, Average and
- Page 100 and 101:
Figure 2-13 Consumer Sentiment and
- Page 102 and 103:
Figure 2-xi Household Debt Service,
- Page 104 and 105:
Ratio to Annual DPI 1.10 1.05 Figur
- Page 106 and 107:
Figure 2-17 National House Price In
- Page 108 and 109:
Index 220 Figure 2-19 Housing Affor
- Page 110 and 111:
Figure 2-21 Composition of Growth i
- Page 112 and 113:
Figure 2-23 Capital Services per Un
- Page 114 and 115:
Box 2-7: Explanations for the Recen
- Page 116 and 117:
Figure 2-xv Business Fixed Investme
- Page 118 and 119:
Figure 2-26 Foreign Real GDP and U.
- Page 120 and 121:
somewhat generalizable (Box 2-8), b
- Page 122 and 123:
prices weakened and the global econ
- Page 124 and 125:
inadequate demand has contributed t
- Page 126 and 127:
Figure 2-31 Nominal Wage Inflation
- Page 128 and 129:
Figure 2-33 Real Hourly Wage Growth
- Page 130 and 131:
Index 6 Figure 2-36 Financial Condi
- Page 132 and 133:
Percent 4.0 Figure 2-38 Nominal Lon
- Page 134 and 135:
Dollars per Barrel 80 Figure 2-40 B
- Page 136 and 137:
Figure 2-41 IMF World Real GDP Grow
- Page 138 and 139:
against the Mexican peso, the Chine
- Page 140 and 141:
United Kingdom It has been a turbul
- Page 142 and 143:
for example, Japan has grown almost
- Page 144 and 145:
Figure 2-45 Credit to Nonfinancial
- Page 146 and 147:
Meanwhile, core inflation (excludin
- Page 148 and 149:
kept rates low across a wide range
- Page 150 and 151:
Investments in surface transportati
- Page 152 and 153:
Table 2-2 Supply-Side Components of
- Page 154:
Conclusion The economy continued to
- Page 157 and 158:
not increased from 1973 to 2013, in
- Page 159 and 160:
developments; individual behavior;
- Page 161 and 162:
action affecting income inequality
- Page 163 and 164:
have occurred. In doing so, these p
- Page 165 and 166:
Percent 24 21 18 15 12 9 6 African
- Page 167 and 168:
without the policy response.5 These
- Page 169 and 170:
Box 3-2: Income Inequality and the
- Page 171 and 172:
unable to obtain insurance at any p
- Page 173 and 174:
Figure 3-7B Percent 50 Uninsured Ra
- Page 175 and 176:
and have not expanded Medicaid foun
- Page 177 and 178:
Box 3-3: Safety Net Policies as Ins
- Page 179 and 180:
Millions of People 18 Figure 3-8 Im
- Page 181 and 182:
Figure 3-9 Effective Tax Rates for
- Page 183 and 184:
Box 3-4: Additional Actions to Make
- Page 185 and 186:
$294 million in newly appropriated
- Page 187 and 188:
15 10 5 0 -5 -10 -15 Figure 3-12 Pe
- Page 189 and 190:
Administration with those of previo
- Page 191 and 192:
as a share of potential GDP by Pres
- Page 193 and 194:
Figure 3-17 Changes in the Distribu
- Page 195 and 196:
30 25 20 15 10 5 0 Single Source: C
- Page 197 and 198:
ate on capital gains and dividends
- Page 200 and 201:
C H A P T E R 4 REFORMING THE HEALT
- Page 202 and 203:
eneficiaries have received cumulati
- Page 204 and 205:
form of lower premium costs and ind
- Page 206 and 207:
Percent 25 20 Creation of Medicare
- Page 208 and 209:
Figure 4-3 Health Insurance Coverag
- Page 210 and 211:
90 80 70 60 50 40 30 20 10 0 25 55
- Page 212 and 213:
Percent Uninsured 25 CHIP Created 2
- Page 214 and 215:
Legislative actions subsequent to C
- Page 216 and 217:
Percent Uninsured 40 35 Figure 4-7
- Page 218 and 219:
ecause of the ACA’s provision all
- Page 220 and 221:
Box 4-2: Dynamics in the Individual
- Page 222 and 223:
projected during the debate over th
- Page 224 and 225:
whelming majority of Marketplace en
- Page 226 and 227:
Figure 4-v Change in Benchmark Prem
- Page 228 and 229:
20 Figure 4-10 Share of Workers in
- Page 230 and 231:
percent during the decade preceding
- Page 232 and 233:
Panel A: Share with a Personal Doct
- Page 234 and 235:
Box 4-3: Interpreting Results from
- Page 236 and 237:
Fortunately, the OHIE is not the on
- Page 238 and 239:
Figure 4-14 Uncompensated Care as a
- Page 240 and 241:
Figure 4-15 Uninsured Rate by Popul
- Page 242 and 243:
Figure 4-17 Monthly Gain in Private
- Page 244 and 245:
Change in Working-Age Employment to
- Page 246 and 247:
this cross-sectional relationship b
- Page 248 and 249:
ecent discussions of macroeconomic
- Page 250 and 251:
Figure 4-23 Life Expectancy at Birt
- Page 252 and 253:
Figure 4-24 Mortality Rate vs. Medi
- Page 254 and 255:
more to cover Medicare patients tha
- Page 256 and 257:
example, through CMMI, the Administ
- Page 258 and 259:
orient payment around the entirety
- Page 260 and 261:
Percent of Payments 60 Figure 4-26
- Page 262 and 263:
covered under ACO contracts at the
- Page 264 and 265:
Additional Steps to Reform the Heal
- Page 266 and 267:
legislation that overrides the reco
- Page 268 and 269:
Figure 4-28 Health Care Price Infla
- Page 270 and 271:
Figure 4-30 Trends in Real Prices f
- Page 272 and 273:
average growth rate of real per enr
- Page 274 and 275:
Figure 4-34 Growth in Real Costs fo
- Page 276 and 277:
made a large, readily quantifiable
- Page 278 and 279:
in states experiencing weaker and s
- Page 280 and 281:
distribution, holding fixed both sp
- Page 282 and 283:
individuals among individuals 65 an
- Page 284 and 285:
Figure 4-40 Average Real Deductible
- Page 286 and 287:
Figure 4-41 Real Per-Enrollee Presc
- Page 288 and 289:
educe the growth rate of Medicare s
- Page 290 and 291:
improvements will strengthen ACOs
- Page 292 and 293:
-5 0 -2 Figure 4-42 Cumulative Perc
- Page 294 and 295:
Woolhandler 2015). These analysts a
- Page 296 and 297:
productivity on the job. These bene
- Page 298 and 299:
Figure 4-46 Premiums and Cost Shari
- Page 300 and 301:
(KFF 2016). Another fifth of tradit
- Page 302 and 303:
2030 2028 2026 2024 2022 2020 2018
- Page 304 and 305:
C H A P T E R 5 INVESTING IN HIGHER
- Page 306 and 307:
Gainful Employment regulations. To
- Page 308 and 309:
Thousands of 2015 Dollars 900 800 7
- Page 310 and 311:
externalities, credit constraints,
- Page 312 and 313:
Figure 5-4 Earnings by Age and Educ
- Page 314 and 315:
Figure 5-5 Variation in Earnings by
- Page 316 and 317:
Box 5-1: Anti-Poverty Efforts and E
- Page 318 and 319:
careers. Some of the effects of the
- Page 320 and 321:
eligibility cutoff likewise finds s
- Page 322 and 323:
Box 5-2: Federal Investments in K-1
- Page 324 and 325:
Evaluations of early local Promise
- Page 326 and 327:
America’s College Promise Playboo
- Page 328 and 329:
Dollars 45,000 40,000 35,000 30,000
- Page 330 and 331:
pre-payment penalty. Second, by tyi
- Page 332 and 333:
equirements, pushed efforts associa
- Page 334 and 335:
Figure 5-16 Size of Outstanding Loa
- Page 336 and 337:
Figure 5-17 Average Monthly Payment
- Page 338 and 339:
Figure 5-18 Distribution of Key Out
- Page 340 and 341:
Figure 5-20 Earnings by Family Inco
- Page 342 and 343:
to student needs and improve test s
- Page 344 and 345:
Box 5-5: Making Sure Students Enter
- Page 346 and 347:
prior, the early FAFSA reform helps
- Page 348 and 349:
Figure 5-ii Number of Institutions
- Page 350 and 351:
Figure 5-23 Gainful Employment Earn
- Page 352 and 353:
Additionally, Pell Grants can be be
- Page 354 and 355:
C H A P T E R 6 STRENGTHENING THE F
- Page 356 and 357:
with no easy way to get the funds f
- Page 358 and 359:
public has limited information, run
- Page 360 and 361:
value added of the sector has gradu
- Page 362 and 363:
managers. Thus, after fees, savers
- Page 364 and 365:
Too Many Resources in Finance? Beyo
- Page 366 and 367:
of the firm after the purchase affe
- Page 368 and 369:
Percent 100 Figure 6-2 Mortgage Ori
- Page 370 and 371:
Figure 6-4 Case-Shiller Home Price
- Page 372 and 373:
Figure 6-7 Global OTC Derivative Ma
- Page 374 and 375:
consumer and investor protections.
- Page 376 and 377:
Figure 6-iv Top 5 Banks as Share of
- Page 378 and 379:
cult to replace with services from
- Page 380 and 381:
Are U.S. Banks Too Big? The questio
- Page 382 and 383:
The three federal banking agencies
- Page 384 and 385:
Risk Taking The Dodd-Frank Act took
- Page 386 and 387:
Box 6-3: The Performance of Communi
- Page 388 and 389:
Figure 6-ix Return on Assets of Ban
- Page 390 and 391:
egulators can take a more holistic
- Page 392 and 393:
Figure 6-13 Repo and Reverse Repo,
- Page 394 and 395:
Figure 6-15 Private Funds Reporting
- Page 396 and 397:
Days 60 Figure 6-16 Weighted-Averag
- Page 398 and 399:
Figure 6-18 Systemic Risk (SRISK),
- Page 400 and 401:
In the absence of another financial
- Page 402 and 403:
lower funding costs in 2007-09, “
- Page 404 and 405:
through the Dodd-Frank Act and othe
- Page 406 and 407:
Prior to the financial crisis, one
- Page 408 and 409:
asis.24 One of the advantages of ce
- Page 410 and 411:
findings from the NRSRO examination
- Page 412 and 413:
Prior to the crisis, enforcement of
- Page 414 and 415:
Box 6-5: Addressing the Problem of
- Page 416 and 417:
Table 6-i Sources of Investment Adv
- Page 418 and 419:
financial system and the systems of
- Page 420 and 421:
Box 6-6: The JOBS Act While it was
- Page 422 and 423:
Figure 6-23 S&P 500, 2003-2016 Inde
- Page 424 and 425:
Figure 6-27 Mortgage Delinquency an
- Page 426:
It created the FSOC to consider ris
- Page 429 and 430:
energy efficient and lower greenhou
- Page 431 and 432:
of domestic actions to reduce green
- Page 433 and 434:
people and vegetation (U.S. Global
- Page 435 and 436:
investment are much higher than the
- Page 437 and 438:
Delaying Action on Climate Change I
- Page 439 and 440:
uses and land management activities
- Page 441 and 442:
Carbon Pollution Standards for Powe
- Page 443 and 444:
a projected range of $16 billion to
- Page 445 and 446:
these resulted in insignificant cha
- Page 447 and 448:
Figure 7-4 Corporate Average Fuel E
- Page 449 and 450:
diesel fuel and jet fuel. The Vehic
- Page 451 and 452:
Box 7-3: Building Resilience to Cur
- Page 453 and 454:
sources in the oil and gas sector,
- Page 455 and 456:
emissions and total greenhouse gas
- Page 457 and 458:
Figure 7-7 Energy Intensity of Real
- Page 459 and 460:
Figure 7-10 U.S. Petroleum Consumpt
- Page 461 and 462:
Figure 7-12 Energy Intensity Transp
- Page 463 and 464:
Figure 7-14c Energy Intensity Comme
- Page 465 and 466:
Figure 7-16 U.S. Energy Consumption
- Page 467 and 468:
2008 to 7 percent in 2015. Figure 7
- Page 469 and 470:
Index, 2008 =0 0.1 0.0 -0.1 Figure
- Page 471 and 472:
Figure 7-23 Decomposition of Emissi
- Page 473 and 474:
three determinants of emissions? If
- Page 475 and 476:
Percent 100 80 Figure 7-26 Sectoral
- Page 477 and 478:
characteristics, and management tre
- Page 479 and 480:
oil and gas sector) were subsequent
- Page 481 and 482:
while creating new jobs and raising
- Page 483 and 484:
such as using similar methodologies
- Page 485 and 486:
Box 7-4: Supporting Increased Penet
- Page 487 and 488:
sector, the fee would incentivize p
- Page 489 and 490:
to be used to decompose emissions i
- Page 491 and 492:
Reinvestment Act.” NBER Working P
- Page 493 and 494:
D’Amico, Stefania, et al. 2012.
- Page 495 and 496:
______. 2016. “Chapter 3: Develop
- Page 497 and 498:
Chetty, Raj, et al. 2014. “Where
- Page 499 and 500:
NBER Working Paper 22170. Cambridge
- Page 501 and 502:
American Hospital Association and H
- Page 503 and 504:
Cantor, Joel C., et al. 2012. “Ea
- Page 505 and 506:
______. 2012a. “Direct Spending a
- Page 507 and 508:
Dranove, David, Craig Garthwaite, a
- Page 509 and 510:
Wars: Global Solutions for Developi
- Page 511 and 512:
Huang, Jidong, and Frank J. Chaloup
- Page 513 and 514:
McWilliams, J. Michael. 2016. “Ch
- Page 515 and 516:
Pinkovskiy, Maxim. 2014. “The Imp
- Page 517 and 518:
______. 2016. “Certification of M
- Page 519 and 520:
Arcidiacono, Peter, V. Joseph Hotz,
- Page 521 and 522:
Bulman, George, and Caroline Hoxby.
- Page 523 and 524:
______. 2015a. “Economic Costs of
- Page 525 and 526:
Dobbie, Will, and Roland G. Fryer J
- Page 527 and 528:
Committee on Health, Education, Lab
- Page 529 and 530: Jepsen, Christopher, Kenneth Troske
- Page 531 and 532: Marcotte, Dave E., et al. 2005. “
- Page 533 and 534: Reynolds, Arthur J., et al. 2011.
- Page 535 and 536: Chapter 6 Acharya, Viral. V., Deniz
- Page 537 and 538: Fama, Eugene F., and Kenneth R. Fre
- Page 539 and 540: Wheelock, David C., and Paul W. Wil
- Page 541 and 542: ______. 2016a. “The Economics of
- Page 543 and 544: ______. 2016c. Short Term Energy Ou
- Page 545 and 546: Interagency Working Group on the So
- Page 547 and 548: Office of Management and Budget (OM
- Page 550: A P P E N D I X A REPORT TO THE PRE
- Page 553 and 554: Council Members and Their Dates of
- Page 556 and 557: Report to the President on the Acti
- Page 558 and 559: consulting with a wide variety of o
- Page 560 and 561: In October, the Council released a
- Page 562 and 563: Research Economists David Boddy . .
- Page 564: A P P E N D I X B STATISTICAL TABLE
- Page 567 and 568: GOVERNMENT FINANCE, INTEREST RATES,
- Page 569 and 570: Year or quarter Table B-1. Percent
- Page 571 and 572: Table B-2. Gross domestic product,
- Page 573 and 574: Table B-3. Quantity and price index
- Page 575 and 576: Table B-5. Real exports and imports
- Page 577 and 578: Year Total Table B-7. Real farm inc
- Page 579: Table B-9. Median money income (in
- Page 583 and 584: Year or month Table B-12. Civilian
- Page 585 and 586: Table B-14. Employees on nonagricul
- Page 587 and 588: Year or month Table B-15. Hours and
- Page 589 and 590: Government Finance, Interest Rates,
- Page 591 and 592: Table B-19. Federal receipts and ou
- Page 593 and 594: Table B-21. Federal and State and l
- Page 595 and 596: Table B-23. U.S. Treasury securitie
- Page 597 and 598: Year and month Bills (at auction) 1
- Page 599: Year and month Table B-26. Money st