Year or month Table B–13. Unemployment by duration and reason, 1972–2016 [Thousands of persons, except as noted; monthly data seasonally adjusted 1 ] Less than 5 weeks 5–14 weeks Duration of unemployment 15–26 weeks 27 weeks and over Average (mean) duration (weeks) 2 Median duration (weeks) Job losers 3 Reason for unemployment Job leavers Unemployment Reentrants New entrants 1972 4,882 2,242 1,472 601 566 12.0 6.2 2,108 582 1,526 641 1,456 677 1973 4,365 2,224 1,314 483 343 10.0 5.2 1,694 472 1,221 683 1,340 649 1974 5,156 2,604 1,597 574 381 9.8 5.2 2,242 746 1,495 768 1,463 681 1975 7,929 2,940 2,484 1,303 1,203 14.2 8.4 4,386 1,671 2,714 827 1,892 823 1976 7,406 2,844 2,196 1,018 1,348 15.8 8.2 3,679 1,050 2,628 903 1,928 895 1977 6,991 2,919 2,132 913 1,028 14.3 7.0 3,166 865 2,300 909 1,963 953 1978 6,202 2,865 1,923 766 648 11.9 5.9 2,585 712 1,873 874 1,857 885 1979 6,137 2,950 1,946 706 535 10.8 5.4 2,635 851 1,784 880 1,806 817 1980 7,637 3,295 2,470 1,052 820 11.9 6.5 3,947 1,488 2,459 891 1,927 872 1981 8,273 3,449 2,539 1,122 1,162 13.7 6.9 4,267 1,430 2,837 923 2,102 981 1982 10,678 3,883 3,311 1,708 1,776 15.6 8.7 6,268 2,127 4,141 840 2,384 1,185 1983 10,717 3,570 2,937 1,652 2,559 20.0 10.1 6,258 1,780 4,478 830 2,412 1,216 1984 8,539 3,350 2,451 1,104 1,634 18.2 7.9 4,421 1,171 3,250 823 2,184 1,110 1985 8,312 3,498 2,509 1,025 1,280 15.6 6.8 4,139 1,157 2,982 877 2,256 1,039 1986 8,237 3,448 2,557 1,045 1,187 15.0 6.9 4,033 1,090 2,943 1,015 2,160 1,029 1987 7,425 3,246 2,196 943 1,040 14.5 6.5 3,566 943 2,623 965 1,974 920 1988 6,701 3,084 2,007 801 809 13.5 5.9 3,092 851 2,241 983 1,809 816 1989 6,528 3,174 1,978 730 646 11.9 4.8 2,983 850 2,133 1,024 1,843 677 1990 7,047 3,265 2,257 822 703 12.0 5.3 3,387 1,028 2,359 1,041 1,930 688 1991 8,628 3,480 2,791 1,246 1,111 13.7 6.8 4,694 1,292 3,402 1,004 2,139 792 1992 9,613 3,376 2,830 1,453 1,954 17.7 8.7 5,389 1,260 4,129 1,002 2,285 937 1993 8,940 3,262 2,584 1,297 1,798 18.0 8.3 4,848 1,115 3,733 976 2,198 919 1994 7,996 2,728 2,408 1,237 1,623 18.8 9.2 3,815 977 2,838 791 2,786 604 1995 7,404 2,700 2,342 1,085 1,278 16.6 8.3 3,476 1,030 2,446 824 2,525 579 1996 7,236 2,633 2,287 1,053 1,262 16.7 8.3 3,370 1,021 2,349 774 2,512 580 1997 6,739 2,538 2,138 995 1,067 15.8 8.0 3,037 931 2,106 795 2,338 569 1998 6,210 2,622 1,950 763 875 14.5 6.7 2,822 866 1,957 734 2,132 520 1999 5,880 2,568 1,832 755 725 13.4 6.4 2,622 848 1,774 783 2,005 469 2000 5,692 2,558 1,815 669 649 12.6 5.9 2,517 852 1,664 780 1,961 434 2001 6,801 2,853 2,196 951 801 13.1 6.8 3,476 1,067 2,409 835 2,031 459 2002 8,378 2,893 2,580 1,369 1,535 16.6 9.1 4,607 1,124 3,483 866 2,368 536 2003 8,774 2,785 2,612 1,442 1,936 19.2 10.1 4,838 1,121 3,717 818 2,477 641 2004 8,149 2,696 2,382 1,293 1,779 19.6 9.8 4,197 998 3,199 858 2,408 686 2005 7,591 2,667 2,304 1,130 1,490 18.4 8.9 3,667 933 2,734 872 2,386 666 2006 7,001 2,614 2,121 1,031 1,235 16.8 8.3 3,321 921 2,400 827 2,237 616 2007 7,078 2,542 2,232 1,061 1,243 16.8 8.5 3,515 976 2,539 793 2,142 627 2008 8,924 2,932 2,804 1,427 1,761 17.9 9.4 4,789 1,176 3,614 896 2,472 766 2009 14,265 3,165 3,828 2,775 4,496 24.4 15.1 9,160 1,630 7,530 882 3,187 1,035 2010 14,825 2,771 3,267 2,371 6,415 33.0 21.4 9,250 1,431 7,819 889 3,466 1,220 2011 13,747 2,677 2,993 2,061 6,016 39.3 21.4 8,106 1,230 6,876 956 3,401 1,284 2012 12,506 2,644 2,866 1,859 5,136 39.4 19.3 6,877 1,183 5,694 967 3,345 1,316 2013 11,460 2,584 2,759 1,807 4,310 36.5 17.0 6,073 1,136 4,937 932 3,207 1,247 2014 9,617 2,471 2,432 1,497 3,218 33.7 14.0 4,878 1,007 3,871 824 2,829 1,086 2015 8,296 2,399 2,302 1,267 2,328 29.2 11.6 4,063 974 3,089 819 2,535 879 2015: Jan 8,920 2,390 2,332 1,371 2,776 32.0 13.4 4,246 919 3,327 851 2,836 1,026 Feb 8,646 2,432 2,251 1,317 2,677 31.4 13.0 4,177 1,027 3,150 880 2,632 949 Mar 8,557 2,488 2,330 1,255 2,547 30.4 12.1 4,194 1,004 3,190 870 2,666 812 Apr 8,523 2,707 2,339 1,162 2,503 30.5 11.6 4,130 959 3,171 824 2,649 867 May 8,619 2,397 2,507 1,286 2,491 30.5 11.6 4,263 1,041 3,222 823 2,584 963 June 8,262 2,347 2,350 1,385 2,128 28.1 11.4 4,060 1,040 3,019 767 2,488 931 July 8,249 2,471 2,249 1,182 2,190 28.3 11.4 4,116 989 3,127 844 2,441 827 Aug 8,018 2,106 2,354 1,254 2,189 28.3 12.1 4,014 968 3,046 787 2,344 846 Sept 7,925 2,373 2,211 1,228 2,109 26.3 11.3 3,883 901 2,982 778 2,443 832 Oct 7,899 2,339 2,295 1,227 2,132 28.0 11.1 3,944 936 3,007 790 2,435 812 Nov 7,924 2,412 2,253 1,270 2,054 27.9 10.7 3,873 939 2,934 800 2,449 847 Dec 7,904 2,405 2,192 1,235 2,085 27.6 10.5 3,796 937 2,859 821 2,476 858 2016: Jan 7,791 2,249 2,282 1,135 2,089 28.9 10.9 3,664 923 2,741 766 2,468 827 Feb 7,815 2,297 2,236 1,132 2,165 29.0 11.2 3,749 960 2,790 760 2,467 833 Mar 7,966 2,412 2,205 1,178 2,213 28.4 11.4 3,835 921 2,914 833 2,495 778 Apr 7,920 2,545 2,131 1,304 2,063 27.7 11.4 3,855 841 3,014 851 2,357 839 May 7,436 2,207 2,239 1,173 1,885 26.7 10.7 3,573 829 2,744 796 2,209 865 June 7,783 2,418 2,140 1,129 1,979 27.7 10.3 3,776 1,097 2,679 828 2,268 902 July 7,770 2,160 2,266 1,150 2,020 28.1 11.6 3,739 997 2,743 824 2,298 826 Aug 7,849 2,290 2,329 1,056 2,006 27.6 11.2 3,791 998 2,792 885 2,271 861 Sept 7,939 2,574 2,234 1,157 1,974 27.5 10.3 3,967 1,075 2,892 893 2,333 805 Oct 7,787 2,397 2,296 1,165 1,979 27.2 10.2 3,749 994 2,755 949 2,354 793 Nov 7,400 2,421 2,136 1,077 1,856 26.3 10.1 3,555 904 2,651 934 2,274 729 1 Because of independent seasonal adjustment of the various series, detail will not sum to totals. 2 Beginning with 2011, includes unemployment durations of up to 5 years; prior data are for up to 2 years. 3 Beginning with 1994, job losers and persons who completed temporary jobs. Note: Data relate to persons 16 years of age and over. See Note, Table B–11. Source: Department of Labor (Bureau of Labor Statistics). Total On layoff Other Labor Market Indicators | 579
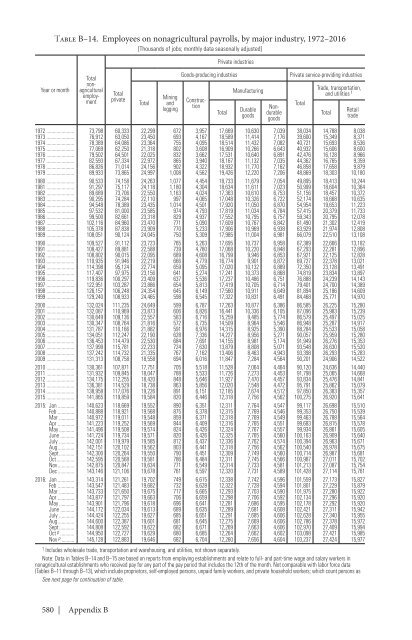
Table B–14. Employees on nonagricultural payrolls, by major industry, 1972–2016 [Thousands of jobs; monthly data seasonally adjusted] Year or month Total private Total Mining and logging Private industries Goods-producing industries Total Manufacturing Durable goods Total nonagricultural employment Construction Nondurable goods Private service-providing industries Total Trade, transportation, and utilities 1 1972 73,798 60,333 22,299 672 3,957 17,669 10,630 7,039 38,034 14,788 8,038 1973 76,912 63,050 23,450 693 4,167 18,589 11,414 7,176 39,600 15,349 8,371 1974 78,389 64,086 23,364 755 4,095 18,514 11,432 7,082 40,721 15,693 8,536 1975 77,069 62,250 21,318 802 3,608 16,909 10,266 6,643 40,932 15,606 8,600 1976 79,502 64,501 22,025 832 3,662 17,531 10,640 6,891 42,476 16,128 8,966 1977 82,593 67,334 22,972 865 3,940 18,167 11,132 7,035 44,362 16,765 9,359 1978 86,826 71,014 24,156 902 4,322 18,932 11,770 7,162 46,858 17,658 9,879 1979 89,933 73,865 24,997 1,008 4,562 19,426 12,220 7,206 48,869 18,303 10,180 1980 90,533 74,158 24,263 1,077 4,454 18,733 11,679 7,054 49,895 18,413 10,244 1981 91,297 75,117 24,118 1,180 4,304 18,634 11,611 7,023 50,999 18,604 10,364 1982 89,689 73,706 22,550 1,163 4,024 17,363 10,610 6,753 51,156 18,457 10,372 1983 90,295 74,284 22,110 997 4,065 17,048 10,326 6,722 52,174 18,668 10,635 1984 94,548 78,389 23,435 1,014 4,501 17,920 11,050 6,870 54,954 19,653 11,223 1985 97,532 81,000 23,585 974 4,793 17,819 11,034 6,784 57,415 20,379 11,733 1986 99,500 82,661 23,318 829 4,937 17,552 10,795 6,757 59,343 20,795 12,078 1987 102,116 84,960 23,470 771 5,090 17,609 10,767 6,842 61,490 21,302 12,419 1988 105,378 87,838 23,909 770 5,233 17,906 10,969 6,938 63,929 21,974 12,808 1989 108,051 90,124 24,045 750 5,309 17,985 11,004 6,981 66,079 22,510 13,108 1990 109,527 91,112 23,723 765 5,263 17,695 10,737 6,958 67,389 22,666 13,182 1991 108,427 89,881 22,588 739 4,780 17,068 10,220 6,848 67,293 22,281 12,896 1992 108,802 90,015 22,095 689 4,608 16,799 9,946 6,853 67,921 22,125 12,828 1993 110,935 91,946 22,219 666 4,779 16,774 9,901 6,872 69,727 22,378 13,021 1994 114,398 95,124 22,774 659 5,095 17,020 10,132 6,889 72,350 23,128 13,491 1995 117,407 97,975 23,156 641 5,274 17,241 10,373 6,868 74,819 23,834 13,897 1996 119,836 100,297 23,409 637 5,536 17,237 10,486 6,751 76,888 24,239 14,143 1997 122,951 103,287 23,886 654 5,813 17,419 10,705 6,714 79,401 24,700 14,389 1998 126,157 106,248 24,354 645 6,149 17,560 10,911 6,649 81,894 25,186 14,609 1999 129,240 108,933 24,465 598 6,545 17,322 10,831 6,491 84,468 25,771 14,970 2000 132,024 111,235 24,649 599 6,787 17,263 10,877 6,386 86,585 26,225 15,280 2001 132,087 110,969 23,873 606 6,826 16,441 10,336 6,105 87,096 25,983 15,239 2002 130,649 109,136 22,557 583 6,716 15,259 9,485 5,774 86,579 25,497 15,025 2003 130,347 108,764 21,816 572 6,735 14,509 8,964 5,546 86,948 25,287 14,917 2004 131,787 110,166 21,882 591 6,976 14,315 8,925 5,390 88,284 25,533 15,058 2005 134,051 112,247 22,190 628 7,336 14,227 8,956 5,271 90,057 25,959 15,280 2006 136,453 114,479 22,530 684 7,691 14,155 8,981 5,174 91,949 26,276 15,353 2007 137,999 115,781 22,233 724 7,630 13,879 8,808 5,071 93,548 26,630 15,520 2008 137,242 114,732 21,335 767 7,162 13,406 8,463 4,943 93,398 26,293 15,283 2009 131,313 108,758 18,558 694 6,016 11,847 7,284 4,564 90,201 24,906 14,522 2010 130,361 107,871 17,751 705 5,518 11,528 7,064 4,464 90,120 24,636 14,440 2011 131,932 109,845 18,047 788 5,533 11,726 7,273 4,453 91,798 25,065 14,668 2012 134,175 112,255 18,420 848 5,646 11,927 7,470 4,457 93,834 25,476 14,841 2013 136,381 114,529 18,738 863 5,856 12,020 7,548 4,472 95,791 25,862 15,079 2014 138,958 117,076 19,226 891 6,151 12,185 7,674 4,512 97,850 26,383 15,357 2015 141,865 119,859 19,584 820 6,446 12,318 7,756 4,562 100,275 26,920 15,641 2015: Jan 140,623 118,669 19,552 890 6,351 12,311 7,764 4,547 99,117 26,698 15,510 Feb 140,888 118,921 19,568 875 6,378 12,315 7,769 4,546 99,353 26,750 15,539 Mar 140,972 119,011 19,548 859 6,371 12,318 7,769 4,549 99,463 26,788 15,564 Apr 141,223 119,252 19,569 844 6,409 12,316 7,765 4,551 99,683 26,815 15,578 May 141,496 119,508 19,574 824 6,426 12,324 7,767 4,557 99,934 26,861 15,605 June 141,724 119,734 19,571 820 6,426 12,325 7,765 4,560 100,163 26,909 15,640 July 142,001 119,979 19,585 812 6,437 12,336 7,762 4,574 100,394 26,963 15,671 Aug 142,151 120,102 19,562 803 6,441 12,318 7,756 4,562 100,540 26,978 15,675 Sept 142,300 120,264 19,550 790 6,451 12,309 7,749 4,560 100,714 26,987 15,681 Oct 142,595 120,568 19,581 786 6,484 12,311 7,745 4,566 100,987 27,011 15,702 Nov 142,875 120,847 19,634 771 6,549 12,314 7,733 4,581 101,213 27,087 15,754 Dec 143,146 121,106 19,678 761 6,597 12,320 7,731 4,589 101,428 27,114 15,761 2016: Jan 143,314 121,261 19,702 749 6,615 12,338 7,742 4,596 101,559 27,173 15,827 Feb 143,547 121,483 19,682 732 6,628 12,322 7,728 4,594 101,801 27,229 15,879 Mar 143,733 121,650 19,675 717 6,665 12,293 7,703 4,590 101,975 27,280 15,922 Apr 143,877 121,797 19,663 706 6,659 12,298 7,706 4,592 102,134 27,296 15,920 May 143,901 121,796 19,618 696 6,641 12,281 7,686 4,595 102,178 27,292 15,920 June 144,172 122,034 19,613 689 6,635 12,289 7,681 4,608 102,421 27,311 15,942 July 144,424 122,255 19,627 685 6,651 12,291 7,685 4,606 102,628 27,340 15,955 Aug 144,600 122,387 19,601 681 6,645 12,275 7,669 4,606 102,786 27,378 15,972 Sept 144,808 122,592 19,622 682 6,671 12,269 7,663 4,606 102,970 27,409 15,994 Oct p 144,950 122,727 19,629 680 6,685 12,264 7,662 4,602 103,098 27,421 15,985 Nov p 145,128 122,883 19,646 682 6,704 12,260 7,656 4,604 103,237 27,424 15,977 1 Includes wholesale trade, transportation and warehousing, and utilities, not shown separately. Note: Data in Tables B–14 and B–15 are based on reports from employing establishments and relate to full- and part-time wage and salary workers in nonagricultural establishments who received pay for any part of the pay period that includes the 12th of the month. Not comparable with labor force data (Tables B–11 through B–13), which include proprietors, self-employed persons, unpaid family workers, and private household workers; which count persons as See next page for continuation of table. Total Retail trade 580 | Appendix B
- Page 1 and 2:
ECONOMIC REPORT OF THE PRESIDENT To
- Page 4:
C O N T E N T S ECONOMIC REPORT OF
- Page 8 and 9:
economic report of the president To
- Page 10 and 11:
eforms in history. Banks have sharp
- Page 12:
the annual report of the council of
- Page 16 and 17:
C O N T E N T S CHAPTER 1: EIGHT YE
- Page 18 and 19:
. THE ECONOMIC RATIONALE FOR FEDERA
- Page 20 and 21:
2.4. Government Purchases as Share
- Page 22 and 23:
4.iii. Premium for the Benchmark Pl
- Page 24 and 25:
6.18. Systemic Risk (SRISK) 2005-20
- Page 26 and 27:
C H A P T E R 1 EIGHT YEARS OF RECO
- Page 28 and 29:
Figure 1-1 Actual and Consensus For
- Page 30 and 31:
Figure 1-3 Real Hourly Wage Growth
- Page 32 and 33:
Figure 1-4 Real GDP per Capita: Eur
- Page 34 and 35:
Figure 1-6 Household Net Worth in t
- Page 36 and 37:
Figure 1-8 Global Trade Flows in th
- Page 38 and 39:
Subsequent revisions to fourth-quar
- Page 40 and 41:
Percent 6 Figure 1-9 Fiscal Expansi
- Page 42 and 43:
substantial costs to the Federal Go
- Page 44 and 45:
worked to promote innovation and in
- Page 46 and 47:
expansion, a period of low producti
- Page 48 and 49:
The 2017 Economic Report of the Pre
- Page 50 and 51:
Chapter 4: Reforming the Health Car
- Page 52 and 53:
to the ACA and other factors. The A
- Page 54 and 55:
than 98 percent of Americans should
- Page 56 and 57:
Figure 1-13 Borrowers in Income Dri
- Page 58 and 59:
success of the financial rescue and
- Page 60 and 61:
einforced U.S. leadership in the ru
- Page 62 and 63:
Partnership (OGP), a global partner
- Page 64 and 65:
Figure 1-16 Labor Productivity Grow
- Page 66 and 67:
Labor Force Participation Household
- Page 68 and 69:
number of steps to ensure that econ
- Page 70 and 71:
C H A P T E R 2 THE YEAR IN REVIEW
- Page 72 and 73:
Percent 11 Figure 2-1 Unemployment
- Page 74 and 75:
allowing for additional investments
- Page 76 and 77:
Percentage Point 0.6 0.4 Figure 2-3
- Page 78 and 79:
public, largely highway constructio
- Page 80 and 81:
The size of the Federal Reserve’s
- Page 82 and 83:
Figure 2-5 Private-Sector Payroll E
- Page 84 and 85:
fell 80 percent from September 2014
- Page 86 and 87:
Figure 2-8 Rates of Part-Time Work,
- Page 88 and 89:
Figure 2-v Prime-Age Male Labor For
- Page 90 and 91:
Output Real GDP grew 1.6 percent ov
- Page 92 and 93:
Figure 2-11 Compensation and Consum
- Page 94 and 95:
Table 2-i Optimal Weighting for Hou
- Page 96 and 97:
esults suggest that, to a first app
- Page 98 and 99:
Figure 2-viii Real GDP, Average and
- Page 100 and 101:
Figure 2-13 Consumer Sentiment and
- Page 102 and 103:
Figure 2-xi Household Debt Service,
- Page 104 and 105:
Ratio to Annual DPI 1.10 1.05 Figur
- Page 106 and 107:
Figure 2-17 National House Price In
- Page 108 and 109:
Index 220 Figure 2-19 Housing Affor
- Page 110 and 111:
Figure 2-21 Composition of Growth i
- Page 112 and 113:
Figure 2-23 Capital Services per Un
- Page 114 and 115:
Box 2-7: Explanations for the Recen
- Page 116 and 117:
Figure 2-xv Business Fixed Investme
- Page 118 and 119:
Figure 2-26 Foreign Real GDP and U.
- Page 120 and 121:
somewhat generalizable (Box 2-8), b
- Page 122 and 123:
prices weakened and the global econ
- Page 124 and 125:
inadequate demand has contributed t
- Page 126 and 127:
Figure 2-31 Nominal Wage Inflation
- Page 128 and 129:
Figure 2-33 Real Hourly Wage Growth
- Page 130 and 131:
Index 6 Figure 2-36 Financial Condi
- Page 132 and 133:
Percent 4.0 Figure 2-38 Nominal Lon
- Page 134 and 135:
Dollars per Barrel 80 Figure 2-40 B
- Page 136 and 137:
Figure 2-41 IMF World Real GDP Grow
- Page 138 and 139:
against the Mexican peso, the Chine
- Page 140 and 141:
United Kingdom It has been a turbul
- Page 142 and 143:
for example, Japan has grown almost
- Page 144 and 145:
Figure 2-45 Credit to Nonfinancial
- Page 146 and 147:
Meanwhile, core inflation (excludin
- Page 148 and 149:
kept rates low across a wide range
- Page 150 and 151:
Investments in surface transportati
- Page 152 and 153:
Table 2-2 Supply-Side Components of
- Page 154:
Conclusion The economy continued to
- Page 157 and 158:
not increased from 1973 to 2013, in
- Page 159 and 160:
developments; individual behavior;
- Page 161 and 162:
action affecting income inequality
- Page 163 and 164:
have occurred. In doing so, these p
- Page 165 and 166:
Percent 24 21 18 15 12 9 6 African
- Page 167 and 168:
without the policy response.5 These
- Page 169 and 170:
Box 3-2: Income Inequality and the
- Page 171 and 172:
unable to obtain insurance at any p
- Page 173 and 174:
Figure 3-7B Percent 50 Uninsured Ra
- Page 175 and 176:
and have not expanded Medicaid foun
- Page 177 and 178:
Box 3-3: Safety Net Policies as Ins
- Page 179 and 180:
Millions of People 18 Figure 3-8 Im
- Page 181 and 182:
Figure 3-9 Effective Tax Rates for
- Page 183 and 184:
Box 3-4: Additional Actions to Make
- Page 185 and 186:
$294 million in newly appropriated
- Page 187 and 188:
15 10 5 0 -5 -10 -15 Figure 3-12 Pe
- Page 189 and 190:
Administration with those of previo
- Page 191 and 192:
as a share of potential GDP by Pres
- Page 193 and 194:
Figure 3-17 Changes in the Distribu
- Page 195 and 196:
30 25 20 15 10 5 0 Single Source: C
- Page 197 and 198:
ate on capital gains and dividends
- Page 200 and 201:
C H A P T E R 4 REFORMING THE HEALT
- Page 202 and 203:
eneficiaries have received cumulati
- Page 204 and 205:
form of lower premium costs and ind
- Page 206 and 207:
Percent 25 20 Creation of Medicare
- Page 208 and 209:
Figure 4-3 Health Insurance Coverag
- Page 210 and 211:
90 80 70 60 50 40 30 20 10 0 25 55
- Page 212 and 213:
Percent Uninsured 25 CHIP Created 2
- Page 214 and 215:
Legislative actions subsequent to C
- Page 216 and 217:
Percent Uninsured 40 35 Figure 4-7
- Page 218 and 219:
ecause of the ACA’s provision all
- Page 220 and 221:
Box 4-2: Dynamics in the Individual
- Page 222 and 223:
projected during the debate over th
- Page 224 and 225:
whelming majority of Marketplace en
- Page 226 and 227:
Figure 4-v Change in Benchmark Prem
- Page 228 and 229:
20 Figure 4-10 Share of Workers in
- Page 230 and 231:
percent during the decade preceding
- Page 232 and 233:
Panel A: Share with a Personal Doct
- Page 234 and 235:
Box 4-3: Interpreting Results from
- Page 236 and 237:
Fortunately, the OHIE is not the on
- Page 238 and 239:
Figure 4-14 Uncompensated Care as a
- Page 240 and 241:
Figure 4-15 Uninsured Rate by Popul
- Page 242 and 243:
Figure 4-17 Monthly Gain in Private
- Page 244 and 245:
Change in Working-Age Employment to
- Page 246 and 247:
this cross-sectional relationship b
- Page 248 and 249:
ecent discussions of macroeconomic
- Page 250 and 251:
Figure 4-23 Life Expectancy at Birt
- Page 252 and 253:
Figure 4-24 Mortality Rate vs. Medi
- Page 254 and 255:
more to cover Medicare patients tha
- Page 256 and 257:
example, through CMMI, the Administ
- Page 258 and 259:
orient payment around the entirety
- Page 260 and 261:
Percent of Payments 60 Figure 4-26
- Page 262 and 263:
covered under ACO contracts at the
- Page 264 and 265:
Additional Steps to Reform the Heal
- Page 266 and 267:
legislation that overrides the reco
- Page 268 and 269:
Figure 4-28 Health Care Price Infla
- Page 270 and 271:
Figure 4-30 Trends in Real Prices f
- Page 272 and 273:
average growth rate of real per enr
- Page 274 and 275:
Figure 4-34 Growth in Real Costs fo
- Page 276 and 277:
made a large, readily quantifiable
- Page 278 and 279:
in states experiencing weaker and s
- Page 280 and 281:
distribution, holding fixed both sp
- Page 282 and 283:
individuals among individuals 65 an
- Page 284 and 285:
Figure 4-40 Average Real Deductible
- Page 286 and 287:
Figure 4-41 Real Per-Enrollee Presc
- Page 288 and 289:
educe the growth rate of Medicare s
- Page 290 and 291:
improvements will strengthen ACOs
- Page 292 and 293:
-5 0 -2 Figure 4-42 Cumulative Perc
- Page 294 and 295:
Woolhandler 2015). These analysts a
- Page 296 and 297:
productivity on the job. These bene
- Page 298 and 299:
Figure 4-46 Premiums and Cost Shari
- Page 300 and 301:
(KFF 2016). Another fifth of tradit
- Page 302 and 303:
2030 2028 2026 2024 2022 2020 2018
- Page 304 and 305:
C H A P T E R 5 INVESTING IN HIGHER
- Page 306 and 307:
Gainful Employment regulations. To
- Page 308 and 309:
Thousands of 2015 Dollars 900 800 7
- Page 310 and 311:
externalities, credit constraints,
- Page 312 and 313:
Figure 5-4 Earnings by Age and Educ
- Page 314 and 315:
Figure 5-5 Variation in Earnings by
- Page 316 and 317:
Box 5-1: Anti-Poverty Efforts and E
- Page 318 and 319:
careers. Some of the effects of the
- Page 320 and 321:
eligibility cutoff likewise finds s
- Page 322 and 323:
Box 5-2: Federal Investments in K-1
- Page 324 and 325:
Evaluations of early local Promise
- Page 326 and 327:
America’s College Promise Playboo
- Page 328 and 329:
Dollars 45,000 40,000 35,000 30,000
- Page 330 and 331:
pre-payment penalty. Second, by tyi
- Page 332 and 333:
equirements, pushed efforts associa
- Page 334 and 335:
Figure 5-16 Size of Outstanding Loa
- Page 336 and 337:
Figure 5-17 Average Monthly Payment
- Page 338 and 339:
Figure 5-18 Distribution of Key Out
- Page 340 and 341:
Figure 5-20 Earnings by Family Inco
- Page 342 and 343:
to student needs and improve test s
- Page 344 and 345:
Box 5-5: Making Sure Students Enter
- Page 346 and 347:
prior, the early FAFSA reform helps
- Page 348 and 349:
Figure 5-ii Number of Institutions
- Page 350 and 351:
Figure 5-23 Gainful Employment Earn
- Page 352 and 353:
Additionally, Pell Grants can be be
- Page 354 and 355:
C H A P T E R 6 STRENGTHENING THE F
- Page 356 and 357:
with no easy way to get the funds f
- Page 358 and 359:
public has limited information, run
- Page 360 and 361:
value added of the sector has gradu
- Page 362 and 363:
managers. Thus, after fees, savers
- Page 364 and 365:
Too Many Resources in Finance? Beyo
- Page 366 and 367:
of the firm after the purchase affe
- Page 368 and 369:
Percent 100 Figure 6-2 Mortgage Ori
- Page 370 and 371:
Figure 6-4 Case-Shiller Home Price
- Page 372 and 373:
Figure 6-7 Global OTC Derivative Ma
- Page 374 and 375:
consumer and investor protections.
- Page 376 and 377:
Figure 6-iv Top 5 Banks as Share of
- Page 378 and 379:
cult to replace with services from
- Page 380 and 381:
Are U.S. Banks Too Big? The questio
- Page 382 and 383:
The three federal banking agencies
- Page 384 and 385:
Risk Taking The Dodd-Frank Act took
- Page 386 and 387:
Box 6-3: The Performance of Communi
- Page 388 and 389:
Figure 6-ix Return on Assets of Ban
- Page 390 and 391:
egulators can take a more holistic
- Page 392 and 393:
Figure 6-13 Repo and Reverse Repo,
- Page 394 and 395:
Figure 6-15 Private Funds Reporting
- Page 396 and 397:
Days 60 Figure 6-16 Weighted-Averag
- Page 398 and 399:
Figure 6-18 Systemic Risk (SRISK),
- Page 400 and 401:
In the absence of another financial
- Page 402 and 403:
lower funding costs in 2007-09, “
- Page 404 and 405:
through the Dodd-Frank Act and othe
- Page 406 and 407:
Prior to the financial crisis, one
- Page 408 and 409:
asis.24 One of the advantages of ce
- Page 410 and 411:
findings from the NRSRO examination
- Page 412 and 413:
Prior to the crisis, enforcement of
- Page 414 and 415:
Box 6-5: Addressing the Problem of
- Page 416 and 417:
Table 6-i Sources of Investment Adv
- Page 418 and 419:
financial system and the systems of
- Page 420 and 421:
Box 6-6: The JOBS Act While it was
- Page 422 and 423:
Figure 6-23 S&P 500, 2003-2016 Inde
- Page 424 and 425:
Figure 6-27 Mortgage Delinquency an
- Page 426:
It created the FSOC to consider ris
- Page 429 and 430:
energy efficient and lower greenhou
- Page 431 and 432:
of domestic actions to reduce green
- Page 433 and 434:
people and vegetation (U.S. Global
- Page 435 and 436:
investment are much higher than the
- Page 437 and 438:
Delaying Action on Climate Change I
- Page 439 and 440:
uses and land management activities
- Page 441 and 442:
Carbon Pollution Standards for Powe
- Page 443 and 444:
a projected range of $16 billion to
- Page 445 and 446:
these resulted in insignificant cha
- Page 447 and 448:
Figure 7-4 Corporate Average Fuel E
- Page 449 and 450:
diesel fuel and jet fuel. The Vehic
- Page 451 and 452:
Box 7-3: Building Resilience to Cur
- Page 453 and 454:
sources in the oil and gas sector,
- Page 455 and 456:
emissions and total greenhouse gas
- Page 457 and 458:
Figure 7-7 Energy Intensity of Real
- Page 459 and 460:
Figure 7-10 U.S. Petroleum Consumpt
- Page 461 and 462:
Figure 7-12 Energy Intensity Transp
- Page 463 and 464:
Figure 7-14c Energy Intensity Comme
- Page 465 and 466:
Figure 7-16 U.S. Energy Consumption
- Page 467 and 468:
2008 to 7 percent in 2015. Figure 7
- Page 469 and 470:
Index, 2008 =0 0.1 0.0 -0.1 Figure
- Page 471 and 472:
Figure 7-23 Decomposition of Emissi
- Page 473 and 474:
three determinants of emissions? If
- Page 475 and 476:
Percent 100 80 Figure 7-26 Sectoral
- Page 477 and 478:
characteristics, and management tre
- Page 479 and 480:
oil and gas sector) were subsequent
- Page 481 and 482:
while creating new jobs and raising
- Page 483 and 484:
such as using similar methodologies
- Page 485 and 486:
Box 7-4: Supporting Increased Penet
- Page 487 and 488:
sector, the fee would incentivize p
- Page 489 and 490:
to be used to decompose emissions i
- Page 491 and 492:
Reinvestment Act.” NBER Working P
- Page 493 and 494:
D’Amico, Stefania, et al. 2012.
- Page 495 and 496:
______. 2016. “Chapter 3: Develop
- Page 497 and 498:
Chetty, Raj, et al. 2014. “Where
- Page 499 and 500:
NBER Working Paper 22170. Cambridge
- Page 501 and 502:
American Hospital Association and H
- Page 503 and 504:
Cantor, Joel C., et al. 2012. “Ea
- Page 505 and 506:
______. 2012a. “Direct Spending a
- Page 507 and 508:
Dranove, David, Craig Garthwaite, a
- Page 509 and 510:
Wars: Global Solutions for Developi
- Page 511 and 512:
Huang, Jidong, and Frank J. Chaloup
- Page 513 and 514:
McWilliams, J. Michael. 2016. “Ch
- Page 515 and 516:
Pinkovskiy, Maxim. 2014. “The Imp
- Page 517 and 518:
______. 2016. “Certification of M
- Page 519 and 520:
Arcidiacono, Peter, V. Joseph Hotz,
- Page 521 and 522:
Bulman, George, and Caroline Hoxby.
- Page 523 and 524:
______. 2015a. “Economic Costs of
- Page 525 and 526:
Dobbie, Will, and Roland G. Fryer J
- Page 527 and 528:
Committee on Health, Education, Lab
- Page 529 and 530:
Jepsen, Christopher, Kenneth Troske
- Page 531 and 532:
Marcotte, Dave E., et al. 2005. “
- Page 533 and 534: Reynolds, Arthur J., et al. 2011.
- Page 535 and 536: Chapter 6 Acharya, Viral. V., Deniz
- Page 537 and 538: Fama, Eugene F., and Kenneth R. Fre
- Page 539 and 540: Wheelock, David C., and Paul W. Wil
- Page 541 and 542: ______. 2016a. “The Economics of
- Page 543 and 544: ______. 2016c. Short Term Energy Ou
- Page 545 and 546: Interagency Working Group on the So
- Page 547 and 548: Office of Management and Budget (OM
- Page 550: A P P E N D I X A REPORT TO THE PRE
- Page 553 and 554: Council Members and Their Dates of
- Page 556 and 557: Report to the President on the Acti
- Page 558 and 559: consulting with a wide variety of o
- Page 560 and 561: In October, the Council released a
- Page 562 and 563: Research Economists David Boddy . .
- Page 564: A P P E N D I X B STATISTICAL TABLE
- Page 567 and 568: GOVERNMENT FINANCE, INTEREST RATES,
- Page 569 and 570: Year or quarter Table B-1. Percent
- Page 571 and 572: Table B-2. Gross domestic product,
- Page 573 and 574: Table B-3. Quantity and price index
- Page 575 and 576: Table B-5. Real exports and imports
- Page 577 and 578: Year Total Table B-7. Real farm inc
- Page 579 and 580: Table B-9. Median money income (in
- Page 581 and 582: Labor Market Indicators Table B-11.
- Page 583: Year or month Table B-12. Civilian
- Page 587 and 588: Year or month Table B-15. Hours and
- Page 589 and 590: Government Finance, Interest Rates,
- Page 591 and 592: Table B-19. Federal receipts and ou
- Page 593 and 594: Table B-21. Federal and State and l
- Page 595 and 596: Table B-23. U.S. Treasury securitie
- Page 597 and 598: Year and month Bills (at auction) 1
- Page 599: Year and month Table B-26. Money st