- Page 1 and 2:
ECONOMIC REPORT OF THE PRESIDENT To
- Page 4:
C O N T E N T S ECONOMIC REPORT OF
- Page 8 and 9:
economic report of the president To
- Page 10 and 11:
eforms in history. Banks have sharp
- Page 12:
the annual report of the council of
- Page 16 and 17:
C O N T E N T S CHAPTER 1: EIGHT YE
- Page 18 and 19:
. THE ECONOMIC RATIONALE FOR FEDERA
- Page 20 and 21:
2.4. Government Purchases as Share
- Page 22 and 23:
4.iii. Premium for the Benchmark Pl
- Page 24 and 25:
6.18. Systemic Risk (SRISK) 2005-20
- Page 26 and 27: C H A P T E R 1 EIGHT YEARS OF RECO
- Page 28 and 29: Figure 1-1 Actual and Consensus For
- Page 30 and 31: Figure 1-3 Real Hourly Wage Growth
- Page 32 and 33: Figure 1-4 Real GDP per Capita: Eur
- Page 34 and 35: Figure 1-6 Household Net Worth in t
- Page 36 and 37: Figure 1-8 Global Trade Flows in th
- Page 38 and 39: Subsequent revisions to fourth-quar
- Page 40 and 41: Percent 6 Figure 1-9 Fiscal Expansi
- Page 42 and 43: substantial costs to the Federal Go
- Page 44 and 45: worked to promote innovation and in
- Page 46 and 47: expansion, a period of low producti
- Page 48 and 49: The 2017 Economic Report of the Pre
- Page 50 and 51: Chapter 4: Reforming the Health Car
- Page 52 and 53: to the ACA and other factors. The A
- Page 54 and 55: than 98 percent of Americans should
- Page 56 and 57: Figure 1-13 Borrowers in Income Dri
- Page 58 and 59: success of the financial rescue and
- Page 60 and 61: einforced U.S. leadership in the ru
- Page 62 and 63: Partnership (OGP), a global partner
- Page 64 and 65: Figure 1-16 Labor Productivity Grow
- Page 66 and 67: Labor Force Participation Household
- Page 68 and 69: number of steps to ensure that econ
- Page 70 and 71: C H A P T E R 2 THE YEAR IN REVIEW
- Page 72 and 73: Percent 11 Figure 2-1 Unemployment
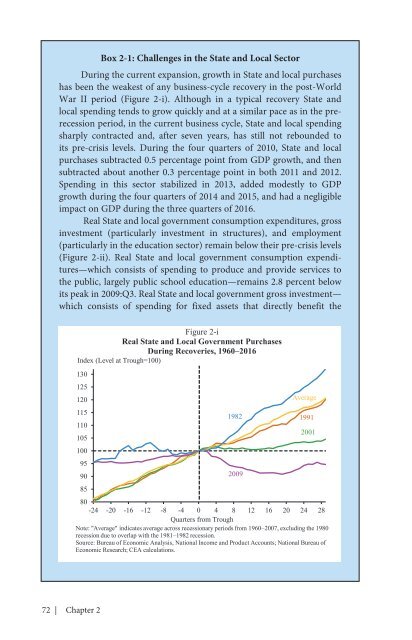
- Page 74 and 75: allowing for additional investments
- Page 78 and 79: public, largely highway constructio
- Page 80 and 81: The size of the Federal Reserve’s
- Page 82 and 83: Figure 2-5 Private-Sector Payroll E
- Page 84 and 85: fell 80 percent from September 2014
- Page 86 and 87: Figure 2-8 Rates of Part-Time Work,
- Page 88 and 89: Figure 2-v Prime-Age Male Labor For
- Page 90 and 91: Output Real GDP grew 1.6 percent ov
- Page 92 and 93: Figure 2-11 Compensation and Consum
- Page 94 and 95: Table 2-i Optimal Weighting for Hou
- Page 96 and 97: esults suggest that, to a first app
- Page 98 and 99: Figure 2-viii Real GDP, Average and
- Page 100 and 101: Figure 2-13 Consumer Sentiment and
- Page 102 and 103: Figure 2-xi Household Debt Service,
- Page 104 and 105: Ratio to Annual DPI 1.10 1.05 Figur
- Page 106 and 107: Figure 2-17 National House Price In
- Page 108 and 109: Index 220 Figure 2-19 Housing Affor
- Page 110 and 111: Figure 2-21 Composition of Growth i
- Page 112 and 113: Figure 2-23 Capital Services per Un
- Page 114 and 115: Box 2-7: Explanations for the Recen
- Page 116 and 117: Figure 2-xv Business Fixed Investme
- Page 118 and 119: Figure 2-26 Foreign Real GDP and U.
- Page 120 and 121: somewhat generalizable (Box 2-8), b
- Page 122 and 123: prices weakened and the global econ
- Page 124 and 125: inadequate demand has contributed t
- Page 126 and 127:
Figure 2-31 Nominal Wage Inflation
- Page 128 and 129:
Figure 2-33 Real Hourly Wage Growth
- Page 130 and 131:
Index 6 Figure 2-36 Financial Condi
- Page 132 and 133:
Percent 4.0 Figure 2-38 Nominal Lon
- Page 134 and 135:
Dollars per Barrel 80 Figure 2-40 B
- Page 136 and 137:
Figure 2-41 IMF World Real GDP Grow
- Page 138 and 139:
against the Mexican peso, the Chine
- Page 140 and 141:
United Kingdom It has been a turbul
- Page 142 and 143:
for example, Japan has grown almost
- Page 144 and 145:
Figure 2-45 Credit to Nonfinancial
- Page 146 and 147:
Meanwhile, core inflation (excludin
- Page 148 and 149:
kept rates low across a wide range
- Page 150 and 151:
Investments in surface transportati
- Page 152 and 153:
Table 2-2 Supply-Side Components of
- Page 154:
Conclusion The economy continued to
- Page 157 and 158:
not increased from 1973 to 2013, in
- Page 159 and 160:
developments; individual behavior;
- Page 161 and 162:
action affecting income inequality
- Page 163 and 164:
have occurred. In doing so, these p
- Page 165 and 166:
Percent 24 21 18 15 12 9 6 African
- Page 167 and 168:
without the policy response.5 These
- Page 169 and 170:
Box 3-2: Income Inequality and the
- Page 171 and 172:
unable to obtain insurance at any p
- Page 173 and 174:
Figure 3-7B Percent 50 Uninsured Ra
- Page 175 and 176:
and have not expanded Medicaid foun
- Page 177 and 178:
Box 3-3: Safety Net Policies as Ins
- Page 179 and 180:
Millions of People 18 Figure 3-8 Im
- Page 181 and 182:
Figure 3-9 Effective Tax Rates for
- Page 183 and 184:
Box 3-4: Additional Actions to Make
- Page 185 and 186:
$294 million in newly appropriated
- Page 187 and 188:
15 10 5 0 -5 -10 -15 Figure 3-12 Pe
- Page 189 and 190:
Administration with those of previo
- Page 191 and 192:
as a share of potential GDP by Pres
- Page 193 and 194:
Figure 3-17 Changes in the Distribu
- Page 195 and 196:
30 25 20 15 10 5 0 Single Source: C
- Page 197 and 198:
ate on capital gains and dividends
- Page 200 and 201:
C H A P T E R 4 REFORMING THE HEALT
- Page 202 and 203:
eneficiaries have received cumulati
- Page 204 and 205:
form of lower premium costs and ind
- Page 206 and 207:
Percent 25 20 Creation of Medicare
- Page 208 and 209:
Figure 4-3 Health Insurance Coverag
- Page 210 and 211:
90 80 70 60 50 40 30 20 10 0 25 55
- Page 212 and 213:
Percent Uninsured 25 CHIP Created 2
- Page 214 and 215:
Legislative actions subsequent to C
- Page 216 and 217:
Percent Uninsured 40 35 Figure 4-7
- Page 218 and 219:
ecause of the ACA’s provision all
- Page 220 and 221:
Box 4-2: Dynamics in the Individual
- Page 222 and 223:
projected during the debate over th
- Page 224 and 225:
whelming majority of Marketplace en
- Page 226 and 227:
Figure 4-v Change in Benchmark Prem
- Page 228 and 229:
20 Figure 4-10 Share of Workers in
- Page 230 and 231:
percent during the decade preceding
- Page 232 and 233:
Panel A: Share with a Personal Doct
- Page 234 and 235:
Box 4-3: Interpreting Results from
- Page 236 and 237:
Fortunately, the OHIE is not the on
- Page 238 and 239:
Figure 4-14 Uncompensated Care as a
- Page 240 and 241:
Figure 4-15 Uninsured Rate by Popul
- Page 242 and 243:
Figure 4-17 Monthly Gain in Private
- Page 244 and 245:
Change in Working-Age Employment to
- Page 246 and 247:
this cross-sectional relationship b
- Page 248 and 249:
ecent discussions of macroeconomic
- Page 250 and 251:
Figure 4-23 Life Expectancy at Birt
- Page 252 and 253:
Figure 4-24 Mortality Rate vs. Medi
- Page 254 and 255:
more to cover Medicare patients tha
- Page 256 and 257:
example, through CMMI, the Administ
- Page 258 and 259:
orient payment around the entirety
- Page 260 and 261:
Percent of Payments 60 Figure 4-26
- Page 262 and 263:
covered under ACO contracts at the
- Page 264 and 265:
Additional Steps to Reform the Heal
- Page 266 and 267:
legislation that overrides the reco
- Page 268 and 269:
Figure 4-28 Health Care Price Infla
- Page 270 and 271:
Figure 4-30 Trends in Real Prices f
- Page 272 and 273:
average growth rate of real per enr
- Page 274 and 275:
Figure 4-34 Growth in Real Costs fo
- Page 276 and 277:
made a large, readily quantifiable
- Page 278 and 279:
in states experiencing weaker and s
- Page 280 and 281:
distribution, holding fixed both sp
- Page 282 and 283:
individuals among individuals 65 an
- Page 284 and 285:
Figure 4-40 Average Real Deductible
- Page 286 and 287:
Figure 4-41 Real Per-Enrollee Presc
- Page 288 and 289:
educe the growth rate of Medicare s
- Page 290 and 291:
improvements will strengthen ACOs
- Page 292 and 293:
-5 0 -2 Figure 4-42 Cumulative Perc
- Page 294 and 295:
Woolhandler 2015). These analysts a
- Page 296 and 297:
productivity on the job. These bene
- Page 298 and 299:
Figure 4-46 Premiums and Cost Shari
- Page 300 and 301:
(KFF 2016). Another fifth of tradit
- Page 302 and 303:
2030 2028 2026 2024 2022 2020 2018
- Page 304 and 305:
C H A P T E R 5 INVESTING IN HIGHER
- Page 306 and 307:
Gainful Employment regulations. To
- Page 308 and 309:
Thousands of 2015 Dollars 900 800 7
- Page 310 and 311:
externalities, credit constraints,
- Page 312 and 313:
Figure 5-4 Earnings by Age and Educ
- Page 314 and 315:
Figure 5-5 Variation in Earnings by
- Page 316 and 317:
Box 5-1: Anti-Poverty Efforts and E
- Page 318 and 319:
careers. Some of the effects of the
- Page 320 and 321:
eligibility cutoff likewise finds s
- Page 322 and 323:
Box 5-2: Federal Investments in K-1
- Page 324 and 325:
Evaluations of early local Promise
- Page 326 and 327:
America’s College Promise Playboo
- Page 328 and 329:
Dollars 45,000 40,000 35,000 30,000
- Page 330 and 331:
pre-payment penalty. Second, by tyi
- Page 332 and 333:
equirements, pushed efforts associa
- Page 334 and 335:
Figure 5-16 Size of Outstanding Loa
- Page 336 and 337:
Figure 5-17 Average Monthly Payment
- Page 338 and 339:
Figure 5-18 Distribution of Key Out
- Page 340 and 341:
Figure 5-20 Earnings by Family Inco
- Page 342 and 343:
to student needs and improve test s
- Page 344 and 345:
Box 5-5: Making Sure Students Enter
- Page 346 and 347:
prior, the early FAFSA reform helps
- Page 348 and 349:
Figure 5-ii Number of Institutions
- Page 350 and 351:
Figure 5-23 Gainful Employment Earn
- Page 352 and 353:
Additionally, Pell Grants can be be
- Page 354 and 355:
C H A P T E R 6 STRENGTHENING THE F
- Page 356 and 357:
with no easy way to get the funds f
- Page 358 and 359:
public has limited information, run
- Page 360 and 361:
value added of the sector has gradu
- Page 362 and 363:
managers. Thus, after fees, savers
- Page 364 and 365:
Too Many Resources in Finance? Beyo
- Page 366 and 367:
of the firm after the purchase affe
- Page 368 and 369:
Percent 100 Figure 6-2 Mortgage Ori
- Page 370 and 371:
Figure 6-4 Case-Shiller Home Price
- Page 372 and 373:
Figure 6-7 Global OTC Derivative Ma
- Page 374 and 375:
consumer and investor protections.
- Page 376 and 377:
Figure 6-iv Top 5 Banks as Share of
- Page 378 and 379:
cult to replace with services from
- Page 380 and 381:
Are U.S. Banks Too Big? The questio
- Page 382 and 383:
The three federal banking agencies
- Page 384 and 385:
Risk Taking The Dodd-Frank Act took
- Page 386 and 387:
Box 6-3: The Performance of Communi
- Page 388 and 389:
Figure 6-ix Return on Assets of Ban
- Page 390 and 391:
egulators can take a more holistic
- Page 392 and 393:
Figure 6-13 Repo and Reverse Repo,
- Page 394 and 395:
Figure 6-15 Private Funds Reporting
- Page 396 and 397:
Days 60 Figure 6-16 Weighted-Averag
- Page 398 and 399:
Figure 6-18 Systemic Risk (SRISK),
- Page 400 and 401:
In the absence of another financial
- Page 402 and 403:
lower funding costs in 2007-09, “
- Page 404 and 405:
through the Dodd-Frank Act and othe
- Page 406 and 407:
Prior to the financial crisis, one
- Page 408 and 409:
asis.24 One of the advantages of ce
- Page 410 and 411:
findings from the NRSRO examination
- Page 412 and 413:
Prior to the crisis, enforcement of
- Page 414 and 415:
Box 6-5: Addressing the Problem of
- Page 416 and 417:
Table 6-i Sources of Investment Adv
- Page 418 and 419:
financial system and the systems of
- Page 420 and 421:
Box 6-6: The JOBS Act While it was
- Page 422 and 423:
Figure 6-23 S&P 500, 2003-2016 Inde
- Page 424 and 425:
Figure 6-27 Mortgage Delinquency an
- Page 426:
It created the FSOC to consider ris
- Page 429 and 430:
energy efficient and lower greenhou
- Page 431 and 432:
of domestic actions to reduce green
- Page 433 and 434:
people and vegetation (U.S. Global
- Page 435 and 436:
investment are much higher than the
- Page 437 and 438:
Delaying Action on Climate Change I
- Page 439 and 440:
uses and land management activities
- Page 441 and 442:
Carbon Pollution Standards for Powe
- Page 443 and 444:
a projected range of $16 billion to
- Page 445 and 446:
these resulted in insignificant cha
- Page 447 and 448:
Figure 7-4 Corporate Average Fuel E
- Page 449 and 450:
diesel fuel and jet fuel. The Vehic
- Page 451 and 452:
Box 7-3: Building Resilience to Cur
- Page 453 and 454:
sources in the oil and gas sector,
- Page 455 and 456:
emissions and total greenhouse gas
- Page 457 and 458:
Figure 7-7 Energy Intensity of Real
- Page 459 and 460:
Figure 7-10 U.S. Petroleum Consumpt
- Page 461 and 462:
Figure 7-12 Energy Intensity Transp
- Page 463 and 464:
Figure 7-14c Energy Intensity Comme
- Page 465 and 466:
Figure 7-16 U.S. Energy Consumption
- Page 467 and 468:
2008 to 7 percent in 2015. Figure 7
- Page 469 and 470:
Index, 2008 =0 0.1 0.0 -0.1 Figure
- Page 471 and 472:
Figure 7-23 Decomposition of Emissi
- Page 473 and 474:
three determinants of emissions? If
- Page 475 and 476:
Percent 100 80 Figure 7-26 Sectoral
- Page 477 and 478:
characteristics, and management tre
- Page 479 and 480:
oil and gas sector) were subsequent
- Page 481 and 482:
while creating new jobs and raising
- Page 483 and 484:
such as using similar methodologies
- Page 485 and 486:
Box 7-4: Supporting Increased Penet
- Page 487 and 488:
sector, the fee would incentivize p
- Page 489 and 490:
to be used to decompose emissions i
- Page 491 and 492:
Reinvestment Act.” NBER Working P
- Page 493 and 494:
D’Amico, Stefania, et al. 2012.
- Page 495 and 496:
______. 2016. “Chapter 3: Develop
- Page 497 and 498:
Chetty, Raj, et al. 2014. “Where
- Page 499 and 500:
NBER Working Paper 22170. Cambridge
- Page 501 and 502:
American Hospital Association and H
- Page 503 and 504:
Cantor, Joel C., et al. 2012. “Ea
- Page 505 and 506:
______. 2012a. “Direct Spending a
- Page 507 and 508:
Dranove, David, Craig Garthwaite, a
- Page 509 and 510:
Wars: Global Solutions for Developi
- Page 511 and 512:
Huang, Jidong, and Frank J. Chaloup
- Page 513 and 514:
McWilliams, J. Michael. 2016. “Ch
- Page 515 and 516:
Pinkovskiy, Maxim. 2014. “The Imp
- Page 517 and 518:
______. 2016. “Certification of M
- Page 519 and 520:
Arcidiacono, Peter, V. Joseph Hotz,
- Page 521 and 522:
Bulman, George, and Caroline Hoxby.
- Page 523 and 524:
______. 2015a. “Economic Costs of
- Page 525 and 526:
Dobbie, Will, and Roland G. Fryer J
- Page 527 and 528:
Committee on Health, Education, Lab
- Page 529 and 530:
Jepsen, Christopher, Kenneth Troske
- Page 531 and 532:
Marcotte, Dave E., et al. 2005. “
- Page 533 and 534:
Reynolds, Arthur J., et al. 2011.
- Page 535 and 536:
Chapter 6 Acharya, Viral. V., Deniz
- Page 537 and 538:
Fama, Eugene F., and Kenneth R. Fre
- Page 539 and 540:
Wheelock, David C., and Paul W. Wil
- Page 541 and 542:
______. 2016a. “The Economics of
- Page 543 and 544:
______. 2016c. Short Term Energy Ou
- Page 545 and 546:
Interagency Working Group on the So
- Page 547 and 548:
Office of Management and Budget (OM
- Page 550:
A P P E N D I X A REPORT TO THE PRE
- Page 553 and 554:
Council Members and Their Dates of
- Page 556 and 557:
Report to the President on the Acti
- Page 558 and 559:
consulting with a wide variety of o
- Page 560 and 561:
In October, the Council released a
- Page 562 and 563:
Research Economists David Boddy . .
- Page 564:
A P P E N D I X B STATISTICAL TABLE
- Page 567 and 568:
GOVERNMENT FINANCE, INTEREST RATES,
- Page 569 and 570:
Year or quarter Table B-1. Percent
- Page 571 and 572:
Table B-2. Gross domestic product,
- Page 573 and 574:
Table B-3. Quantity and price index
- Page 575 and 576:
Table B-5. Real exports and imports
- Page 577 and 578:
Year Total Table B-7. Real farm inc
- Page 579 and 580:
Table B-9. Median money income (in
- Page 581 and 582:
Labor Market Indicators Table B-11.
- Page 583 and 584:
Year or month Table B-12. Civilian
- Page 585 and 586:
Table B-14. Employees on nonagricul
- Page 587 and 588:
Year or month Table B-15. Hours and
- Page 589 and 590:
Government Finance, Interest Rates,
- Page 591 and 592:
Table B-19. Federal receipts and ou
- Page 593 and 594:
Table B-21. Federal and State and l
- Page 595 and 596:
Table B-23. U.S. Treasury securitie
- Page 597 and 598:
Year and month Bills (at auction) 1
- Page 599:
Year and month Table B-26. Money st