130218_Luxor-Egypt SECAP Final

You also want an ePaper? Increase the reach of your titles
YUMPU automatically turns print PDFs into web optimized ePapers that Google loves.
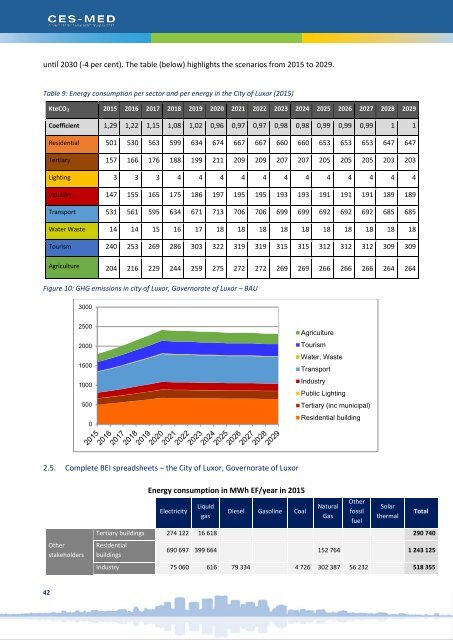
until 2030 (-4 per cent). The table (below) highlights the scenarios from 2015 to 2029.<br />
Table 9: Energy consumption per sector and per energy in the City of <strong>Luxor</strong> (2015)<br />
KteCO 2 2015 2016 2017 2018 2019 2020 2021 2022 2023 2024 2025 2026 2027 2028 2029<br />
Coefficient 1,29 1,22 1,15 1,08 1,02 0,96 0,97 0,97 0,98 0,98 0,99 0,99 0,99 1 1<br />
Residential 501 530 563 599 634 674 667 667 660 660 653 653 653 647 647<br />
Tertiary 157 166 176 188 199 211 209 209 207 207 205 205 205 203 203<br />
Lighting 3 3 3 4 4 4 4 4 4 4 4 4 4 4 4<br />
Industry 147 155 165 175 186 197 195 195 193 193 191 191 191 189 189<br />
Transport 531 561 595 634 671 713 706 706 699 699 692 692 692 685 685<br />
Water Waste 14 14 15 16 17 18 18 18 18 18 18 18 18 18 18<br />
Tourism 240 253 269 286 303 322 319 319 315 315 312 312 312 309 309<br />
Agriculture 204 216 229 244 259 275 272 272 269 269 266 266 266 264 264<br />
Figure 10: GHG emissions in city of <strong>Luxor</strong>, Governorate of <strong>Luxor</strong> – BAU<br />
3000<br />
2500<br />
2000<br />
1500<br />
1000<br />
500<br />
0<br />
Agriculture<br />
Tourism<br />
Water, Waste<br />
Transport<br />
Industry<br />
Public Lighting<br />
Tertiary (inc municipal)<br />
Residential building<br />
2.5. Complete BEI spreadsheets – the City of <strong>Luxor</strong>, Governorate of <strong>Luxor</strong><br />
Other<br />
stakeholders<br />
Energy consumption in MWh EF/year in 2015<br />
Electricity<br />
Liquid<br />
gas<br />
Diesel Gasoline Coal<br />
Natural<br />
Gas<br />
Other<br />
fossil<br />
fuel<br />
Solar<br />
thermal<br />
Tertiary buildings 274 122 16 618 0 0 0 0 0 290 740<br />
Residential<br />
buildings<br />
Total<br />
690 697 399 664 0 0 0 152 764 0 1 243 125<br />
Industry 75 060 616 79 334 0 4 726 302 387 56 232 518 355<br />
42