- Page 1 and 2:
AMERICAN SOCIETY OF CLINICAL ONCOLO
- Page 3 and 4:
American Society of Clinical Oncolo
- Page 5 and 6:
American Society of Clinical Oncolo
- Page 7 and 8:
New Looks and Challenges for Cooper
- Page 9 and 10:
Genitourinary Cancer Best Use of Im
- Page 11 and 12:
Research and Standard of Care: Lung
- Page 13 and 14:
Practice Management and Information
- Page 15 and 16:
2012 ASCO Annual Meeting Disclosure
- Page 17 and 18:
Matti S. Aapro, MD Clinique De Geno
- Page 19 and 20:
Hedy Lee Kindler, MD The University
- Page 21 and 22:
Douglas E. Wood, MD University of W
- Page 23 and 24:
Mary Lou Smith, JD, MBA Research Ad
- Page 25 and 26:
ASCO and Conquer Cancer Foundation
- Page 27 and 28:
Letter from the Editor The theme of
- Page 29 and 30:
Adjuvant Therapy for Older Women wi
- Page 31 and 32:
TREATMENT FOR OLDER WOMEN WITH BREA
- Page 33 and 34:
TREATMENT FOR OLDER WOMEN WITH BREA
- Page 35 and 36:
TREATMENT FOR OLDER WOMEN WITH BREA
- Page 37 and 38:
MANAGEMENT OF T1 BREAST CANCERS the
- Page 39 and 40:
MANAGEMENT OF T1 BREAST CANCERS Tab
- Page 41 and 42:
MANAGEMENT OF T1 BREAST CANCERS Tab
- Page 43 and 44:
MANAGEMENT OF T1 BREAST CANCERS 93.
- Page 45 and 46:
MANAGEMENT OF T1 BREAST CANCERS 1 c
- Page 47 and 48:
ADJUVANT ENDOCRINE THERAPY reductio
- Page 49 and 50:
ADJUVANT ENDOCRINE THERAPY which ra
- Page 51 and 52:
ADJUVANT ENDOCRINE THERAPY assay is
- Page 53 and 54:
A DICKENS TALE OF THE TREATMENT OF
- Page 55 and 56:
TREATMENT OF ADVANCED BREAST CANCER
- Page 57 and 58:
TREATMENT OF ADVANCED BREAST CANCER
- Page 59 and 60:
TREATMENT OF ADVANCED BREAST CANCER
- Page 61 and 62:
TREATMENT OF ADVANCED BREAST CANCER
- Page 63 and 64:
TREATMENT OF ADVANCED BREAST CANCER
- Page 65 and 66:
A FRESH LOOK AT DUCTAL CARCINOMA IN
- Page 67 and 68:
DCIS: OPPORTUNITIES AND UNCHARTED W
- Page 69 and 70:
DCIS: OPPORTUNITIES AND UNCHARTED W
- Page 71 and 72:
Ductal Carcinoma In Situ, and the I
- Page 73 and 74:
DCIS AND INFLUENCE OF RISK FACTORS
- Page 75 and 76:
KEY QUESTIONS IN THE LOCO-REGIONAL
- Page 77 and 78:
POSTMASTECTOMY RADIATION AND PARTIA
- Page 79 and 80:
The Appropriate Extent of Surgery f
- Page 81 and 82:
SURGERY FOR EARLY-STAGE BREAST CANC
- Page 83 and 84:
BIOLOGY AND LOCAL THERAPY DECISIONS
- Page 85 and 86:
Clinical and Imaging Surveillance F
- Page 87 and 88:
SURVEILLANCE FOLLOWING BREAST CANCE
- Page 89 and 90:
SURVEILLANCE FOLLOWING BREAST CANCE
- Page 91 and 92:
Advanced Imaging Techniques for the
- Page 93 and 94:
IMAGING TECHNIQUES FOR BREAST CANCE
- Page 95 and 96:
IMAGING TECHNIQUES FOR BREAST CANCE
- Page 97 and 98:
Update of the Oxford Overview: New
- Page 99 and 100:
UPDATE OF THE OXFORD OVERVIEW Fig.
- Page 101 and 102:
UPDATE OF THE OXFORD OVERVIEW Fig.
- Page 103 and 104:
UPDATE OF THE OXFORD OVERVIEW Fig.
- Page 105 and 106:
UPDATE OF THE OXFORD OVERVIEW Overv
- Page 107 and 108:
Gene Patents and Personalized Medic
- Page 109 and 110:
GENE PATENTS AND EFFECTS ON PERSONA
- Page 111 and 112:
Chemoprevention for Breast Cancer:
- Page 113 and 114:
CHEMOPREVENTION FOR BREAST CANCER T
- Page 115 and 116:
CHEMOPREVENTION FOR BREAST CANCER C
- Page 117 and 118:
CONTROVERSIES IN PROSTATE CANCER: P
- Page 119 and 120:
PROSTATE CANCER RISK REDUCTION men
- Page 121 and 122:
PROSTATE CANCER RISK REDUCTION Auth
- Page 123 and 124:
PSA SCREENING: HARMS WITHOUT CLEAR
- Page 125 and 126:
PSA SCREENING: HARMS WITHOUT CLEAR
- Page 127 and 128:
GLIOBLASTOMA: TAKING THE STANDARD O
- Page 129 and 130:
GLIOBLASTOMA: BIOLOGY, GENETICS AND
- Page 131 and 132:
GLIOBLASTOMA: BIOLOGY, GENETICS AND
- Page 133 and 134:
GLIOBLASTOMA: BIOLOGY, GENETICS AND
- Page 135 and 136:
FUTURE DIRECTIONS IN GBM THERAPY pr
- Page 137 and 138:
FUTURE DIRECTIONS IN GBM THERAPY Ch
- Page 139 and 140:
ESTABLISHING TREATMENTS FOR GLIOBLA
- Page 141 and 142:
ESTABLISHING TREATMENTS FOR GLIOBLA
- Page 143 and 144:
ESTABLISHING TREATMENTS FOR GLIOBLA
- Page 145 and 146:
Current Concepts in Brain Tumor Ima
- Page 147 and 148:
CONCEPTS IN BRAIN TUMOR IMAGING tum
- Page 149 and 150:
CONCEPTS IN BRAIN TUMOR IMAGING Aut
- Page 151 and 152:
PERSPECTIVES ON HEADLINE-MAKING NEW
- Page 153 and 154:
TTF THERAPY IN GLIOBLASTOMA Fig. 1.
- Page 155 and 156:
TTF THERAPY IN GLIOBLASTOMA istics.
- Page 157 and 158:
TTF THERAPY IN GLIOBLASTOMA because
- Page 159 and 160:
Limitations of Adaptive Clinical Tr
- Page 161 and 162:
LIMITATIONS OF ADAPTIVE CLINICAL TR
- Page 163 and 164:
LIMITATIONS OF ADAPTIVE CLINICAL TR
- Page 165 and 166:
Capturing the Patient Perspective:
- Page 167 and 168:
PATIENT-REPORTED OUTCOMES AS TRIAL
- Page 169 and 170:
PATIENT-REPORTED OUTCOMES AS TRIAL
- Page 171 and 172:
NEW LOOKS AND CHALLENGES FOR COOPER
- Page 173 and 174:
NCI NATIONAL CLINICAL TRIALS NETWOR
- Page 175 and 176:
Successful Integration of Cooperati
- Page 177 and 178:
COG: GIVING NEW MEANING TO COOPERAT
- Page 179 and 180:
A Critical Review of the Enrollment
- Page 181 and 182:
BLACK PATIENTS AND CANCER CLINICAL
- Page 183 and 184:
BLACK PATIENTS AND CANCER CLINICAL
- Page 185 and 186:
Trastuzumab Emtansine (T-DM1): Hitc
- Page 187 and 188:
T-DM1 AND THERAPEUTIC ANTIBODIES ag
- Page 189 and 190:
TARGETING CD30 IN HODGKIN LYMPHOMA
- Page 191 and 192:
TARGETING CD30 IN HODGKIN LYMPHOMA
- Page 193 and 194:
EARLY DRUG DEVELOPMENT: CASTING A W
- Page 195 and 196:
Table 1. Response Rates in Expanded
- Page 197 and 198:
Drug Development in the Era of Pers
- Page 199 and 200:
that the core pathway is not comple
- Page 201 and 202:
This situation is not surprising, g
- Page 203 and 204:
Practical Management of Immune-Rela
- Page 205 and 206:
the anterior pituitary axis is invo
- Page 207 and 208:
TARGETING CRITICAL MOLECULAR ABERRA
- Page 209 and 210:
Abl suppression; and 3) the early e
- Page 211 and 212:
50% 50% 100% Change in Tumor Size m
- Page 213 and 214:
vanced solid tumors, even if they a
- Page 215 and 216:
Targeting Molecular Aberrations in
- Page 217 and 218:
date. With the advent of gene expre
- Page 219 and 220:
consortium to facilitate the testin
- Page 221 and 222:
ETHICAL CHALLENGES OF HEALTH CARE R
- Page 223 and 224:
HEALTH CARE REFORM AND ONCOLOGY dev
- Page 225 and 226:
HEALTH CARE REFORM AND ONCOLOGY aut
- Page 227 and 228:
INTERNATIONAL VARIATION IN UNDERSTA
- Page 229 and 230:
midcareer physician; in one cross-s
- Page 231 and 232:
Table 1. Recommendations for Person
- Page 233 and 234:
stances (e.g., stage of career, fam
- Page 235 and 236:
elationship” is also acknowledged
- Page 237 and 238:
Conclusion In more individualistic
- Page 239 and 240:
The Oncologist’s Duty to Provide
- Page 241 and 242:
an external observer, but to the pe
- Page 243 and 244:
MEDICAL ERRORS IN CANCER CARE: PREV
- Page 245 and 246:
DISCLOSING MEDICAL ERRORS Disclosur
- Page 247 and 248:
DISCLOSING MEDICAL ERRORS Author’
- Page 249 and 250:
PREVENTING MEDICAL ERRORS more diff
- Page 251 and 252:
“PERSONALIZED” ONCOLOGY FOR COL
- Page 253 and 254:
0.001), progression-free survival (
- Page 255 and 256:
mately 40% of patients with colorec
- Page 257 and 258:
Table 1. Tumor Marker Utility Gradi
- Page 259 and 260:
treatment (tx) for metastatic color
- Page 261 and 262:
The Interventional Radiologist Role
- Page 263 and 264:
effect. The most common drug that h
- Page 265 and 266:
gone forever, no further therapy is
- Page 267 and 268:
is irrelevant if it is already rese
- Page 269 and 270:
Resection and Thermal Ablation of L
- Page 271 and 272:
Author’s Disclosures of Potential
- Page 273 and 274:
Minimally Invasive Surgery of Recta
- Page 275 and 276:
outcomes; local, wound-site, and di
- Page 277 and 278:
Authors’ Disclosures of Potential
- Page 279 and 280:
CAO/ARO 04 study—which added oxal
- Page 281 and 282:
STAGE III COLON CANCER: WHAT WORKS,
- Page 283 and 284:
Table 1. Comparison of Fluoropyrimi
- Page 285 and 286:
tients with stages II and III color
- Page 287 and 288:
ized by high fruit, vegetable, poul
- Page 289 and 290:
Exercise Change trial: a randomized
- Page 291 and 292:
A New Direction for Pancreatic Canc
- Page 293 and 294:
Table 1. FOLFIRINOX versus Gemcitab
- Page 295 and 296:
The Southwest Oncology Group (SWOG)
- Page 297 and 298:
A Matter of Timing: Is There a Role
- Page 299 and 300:
an OS benefit with radiation therap
- Page 301 and 302:
a dose of 50.4 Gy to 59.4 Gy of rad
- Page 303 and 304:
more commonly given for APC, specia
- Page 305 and 306:
subcutaneous bolus or infusion. Hal
- Page 307 and 308:
patients are cared for completely w
- Page 309 and 310:
Varying Lymphadenectomies for Gastr
- Page 311 and 312:
Table 1. Regional Lymph Nodes of th
- Page 313 and 314:
Conclusion There are clear differen
- Page 315 and 316:
Will Disease Heterogeneity Help Def
- Page 317 and 318:
prematurely due to poor accrual. 18
- Page 319 and 320:
Adjuvant Treatments for Localized A
- Page 321 and 322:
ADJUVANT TREATMENT FOR GASTRIC CANC
- Page 323 and 324:
LIVER-DIRECTED THERAPEUTIC OPTIONS
- Page 325 and 326:
ated with unique dose distributions
- Page 327 and 328:
HCC, with encouraging outcomes in e
- Page 329 and 330:
tion. Advanced computer-based image
- Page 331 and 332:
a 5-year survival rate of 70% follo
- Page 333 and 334:
THE MANAGEMENT OF LESS COMMON BUT C
- Page 335 and 336:
Fig 1. PubMed publications and clin
- Page 337 and 338:
of therapeutic options, patient sel
- Page 339 and 340:
less informative than the GRETCH an
- Page 341 and 342:
Table 3. New Agents/Regimens under
- Page 343 and 344:
combined with concurrent transarter
- Page 345 and 346:
to optimize the use of erlotinib by
- Page 347 and 348:
Optimal Use of Imaging to Guide Tre
- Page 349 and 350:
enhancement seen. Furthermore, the
- Page 351 and 352:
CASTRATION-RESISTANT PROSTATE CANCE
- Page 353 and 354:
Fig. 1. FDA regulatory approvals in
- Page 355 and 356:
Prognostic, Predictive, and Surroga
- Page 357 and 358:
adhesion molecule and further chara
- Page 359 and 360:
and treatment options are expanding
- Page 361 and 362:
KIDNEY CANCER BIOLOGY AND THERAPEUT
- Page 363 and 364:
Prognostic Factors in Advanced RCC
- Page 365 and 366:
cell immunotherapy in which a small
- Page 367 and 368:
New Developments in Urothelial Canc
- Page 369 and 370:
Novel Approaches in Advanced Urothe
- Page 371 and 372:
10. Albers P, Park SI, Niegisch G,
- Page 373 and 374:
700 at a dose of 400 mg twice daily
- Page 375 and 376:
therapy for nonmetastatic prostate
- Page 377 and 378:
ADJUVANT THERAPY FOR OLDER PATIENTS
- Page 379 and 380:
Adjuvant Systemic Therapy Adjuvant
- Page 381 and 382:
with early-stage breast cancer were
- Page 383 and 384:
clinical trials to generate additio
- Page 385 and 386:
Adjuvant Treatment of Older Patient
- Page 387 and 388:
OLDER PATIENTS WITH LUNG CANCER Fig
- Page 389 and 390:
OLDER PATIENTS WITH LUNG CANCER adj
- Page 391 and 392:
Considerations and Controversies in
- Page 393 and 394:
OLDER PATIENTS WITH ADVANCED CANCER
- Page 395 and 396:
OLDER PATIENTS WITH ADVANCED CANCER
- Page 397 and 398: OLDER PATIENTS WITH ADVANCED CANCER
- Page 399 and 400: RECENT CLINICAL HIGHLIGHTS IN GYNEC
- Page 401 and 402: GLOBAL ADVANCES IN GYNECOLOGIC ONCO
- Page 403 and 404: GLOBAL ADVANCES IN GYNECOLOGIC ONCO
- Page 405 and 406: The European Society of Gynaecologi
- Page 407 and 408: ESGO EDUCATIONAL AND RESEARCH ACTIV
- Page 409 and 410: UPFRONT TREATMENT OF OVARIAN CANCER
- Page 411 and 412: ANTIANGIOGENICS AND PARP INHIBITORS
- Page 413 and 414: ANTIANGIOGENICS AND PARP INHIBITORS
- Page 415 and 416: Intraperitoneal Treatment in Ovaria
- Page 417 and 418: INTRAPERITONEAL TREATMENT IN OVARIA
- Page 419 and 420: Dose-Dense Chemotherapy and Neoadju
- Page 421 and 422: CHEMOTHERAPY FOR OVARIAN CANCER Fig
- Page 423 and 424: CHEMOTHERAPY FOR OVARIAN CANCER whi
- Page 425 and 426: UTERINE SARCOMA: CHALLENGING CASES
- Page 427 and 428: HISTOLOGIC FEATURES AND MANAGEMENT
- Page 429 and 430: HISTOLOGIC FEATURES AND MANAGEMENT
- Page 431 and 432: HISTOLOGIC FEATURES AND MANAGEMENT
- Page 433 and 434: SURGICAL OPTIONS FOR UTERINE SARCOM
- Page 435 and 436: SURGICAL OPTIONS FOR UTERINE SARCOM
- Page 437 and 438: PATIENTS WITH HPV-POSITIVE OROPHARY
- Page 439 and 440: HPV-INDUCED OROPHARYNX CANCER analy
- Page 441 and 442: HPV-INDUCED OROPHARYNX CANCER fract
- Page 443 and 444: Important Early Advances in Squamou
- Page 445 and 446: EARLY ADVANCES IN SCCHN Fig 1. Targ
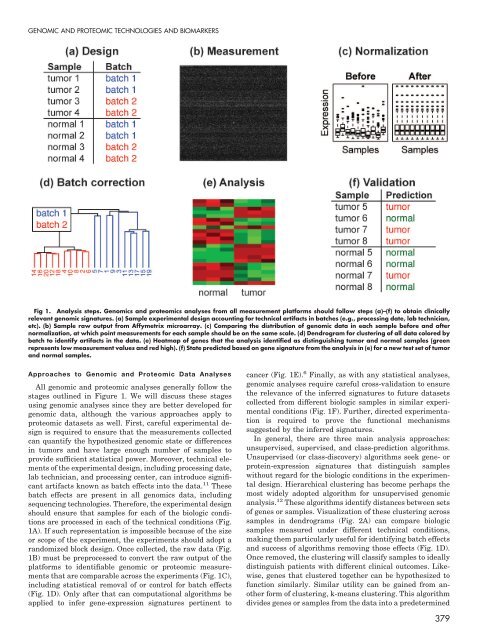
- Page 447: Application of Genomic and Proteomi
- Page 451 and 452: GENOMIC AND PROTEOMIC TECHNOLOGIES
- Page 453 and 454: TREATMENT OF THYROID CANCERS: NEW I
- Page 455 and 456: EVALUATION OF ADVANCED THYROID CANC
- Page 457 and 458: EVALUATION OF ADVANCED THYROID CANC
- Page 459 and 460: Systemic Therapeutic Approaches to
- Page 461 and 462: APPROACHES TO ADVANCED THYROID CANC
- Page 463 and 464: AVOIDING OVERDIAGNOSIS AND OVERTREA
- Page 465 and 466: Table 1. Prevalence of Prostate Can
- Page 467 and 468: Table 3. Potential Risks and Benefi
- Page 469 and 470: Overdiagnosis and Overtreatment of
- Page 471 and 472: een reached by other modeling effor
- Page 473 and 474: east cancer community have FDA-appr
- Page 475 and 476: COSTS OF CANCER CARE: AFFORDABILITY
- Page 477 and 478: REDUCING THE COST OF CANCER CARE Fi
- Page 479 and 480: REDUCING THE COST OF CANCER CARE Th
- Page 481 and 482: REDUCING THE COST OF CANCER CARE de
- Page 483 and 484: Why Hasn’t Genomic Testing Change
- Page 485 and 486: tigators should develop prospective
- Page 487 and 488: MANAGEMENT OF CHRONIC LYMPHOCYTIC L
- Page 489 and 490: PREDICTIVE PARAMETERS IN CLL Table
- Page 491 and 492: PREDICTIVE PARAMETERS IN CLL patien
- Page 493 and 494: Transplant in Chronic Lymphocytic L
- Page 495 and 496: WHEN TO OFFER TRANSPLANTATION IN CL
- Page 497 and 498: WHEN TO OFFER TRANSPLANTATION IN CL
- Page 499 and 500:
NEW DEVELOPMENTS IN MYELOPROLIFERAT
- Page 501 and 502:
SMALL-MOLECULE INHIBITORS FOR MPN S
- Page 503 and 504:
SMALL-MOLECULE INHIBITORS FOR MPN L
- Page 505 and 506:
Insights into the Molecular Genetic
- Page 507 and 508:
GENETICS OF MYELOPROLIFERATIVE NEOP
- Page 509 and 510:
GENETICS OF MYELOPROLIFERATIVE NEOP
- Page 511 and 512:
GENETICS OF MYELOPROLIFERATIVE NEOP
- Page 513 and 514:
Classification of Myeloproliferativ
- Page 515 and 516:
CLASSIFICATION AND PROGNOSIS OF MPN
- Page 517 and 518:
CLASSIFICATION AND PROGNOSIS OF MPN
- Page 519 and 520:
AROUND THE WORLD IN ALMOST 80 MINUT
- Page 521 and 522:
LUNG CANCER IN BRAZIL Fig. 1. Relat
- Page 523 and 524:
LUNG CANCER IN BRAZIL Fig. 3. Chara
- Page 525 and 526:
LUNG CANCER IN BRAZIL Author’s Di
- Page 527 and 528:
LUNG CANCER IN CHINA Fig 1. Chinese
- Page 529 and 530:
LUNG CANCER IN CHINA well equipped
- Page 531 and 532:
Research and Standard of Care: Lung
- Page 533 and 534:
LUNG CANCER IN ROMANIA ● Protecti
- Page 535 and 536:
LUNG CANCER IN ROMANIA reimbursemen
- Page 537 and 538:
A New Model: Physician-Patient Coll
- Page 539 and 540:
PHYSICIAN ENGAGEMENT IN ONLINE PATI
- Page 541 and 542:
PHYSICIAN ENGAGEMENT IN ONLINE PATI
- Page 543 and 544:
LUNG CANCER SCREENING 101 CHAIR Chr
- Page 545 and 546:
LUNG CANCER SCREENING The concern i
- Page 547 and 548:
LUNG CANCER SCREENING Fig. 1. Guide
- Page 549 and 550:
LUNG CANCER SCREENING Fig. 2. Guide
- Page 551 and 552:
LUNG CANCER SCREENING 19. Montes RP
- Page 553 and 554:
Molecular Testing of Non-Small Cell
- Page 555 and 556:
MOLECULAR TESTING AND NSCLC Fig 1.
- Page 557 and 558:
MOLECULAR TESTING AND NSCLC logic d
- Page 559 and 560:
THYMOMA AND THYMIC CARCINOMA: UPDAT
- Page 561 and 562:
MANAGEMENT OF THYMIC CARCINOMA recu
- Page 563 and 564:
MANAGEMENT OF THYMIC CARCINOMA Refe
- Page 565 and 566:
The Creation of the International T
- Page 567 and 568:
ITMIG AS A MODEL FOR RARE DISEASES
- Page 569 and 570:
Thymoma: From Chemotherapy to Targe
- Page 571 and 572:
SYSTEMIC TREATMENT OF THYMOMA Study
- Page 573 and 574:
SYSTEMIC TREATMENT OF THYMOMA cance
- Page 575 and 576:
What Is the Best Strategy for Incor
- Page 577 and 578:
TREATMENT OF FOLLICULAR LYMPHOMA Fi
- Page 579 and 580:
TREATMENT OF FOLLICULAR LYMPHOMA me
- Page 581 and 582:
TREATMENT OF FOLLICULAR LYMPHOMA ou
- Page 583 and 584:
TREATMENT OPTIONS IN INDOLENT LYMPH
- Page 585 and 586:
TREATMENT OPTIONS IN INDOLENT LYMPH
- Page 587 and 588:
TREATMENT OPTIONS IN INDOLENT LYMPH
- Page 589 and 590:
ROLE OF HCT FOR INDOLENT LYMPHOMA T
- Page 591 and 592:
ROLE OF HCT FOR INDOLENT LYMPHOMA T
- Page 593 and 594:
ROLE OF HCT FOR INDOLENT LYMPHOMA e
- Page 595 and 596:
CONTROVERSIES IN MYELOMA: INDUCTION
- Page 597 and 598:
TRANSPLANTATION FOR MYELOMA Alterna
- Page 599 and 600:
TRANSPLANTATION FOR MYELOMA compare
- Page 601 and 602:
TRANSPLANTATION FOR MYELOMA autolog
- Page 603 and 604:
CURRENT STATUS OF MYELOMA THERAPY K
- Page 605 and 606:
CURRENT STATUS OF MYELOMA THERAPY F
- Page 607 and 608:
CURRENT STATUS OF MYELOMA THERAPY T
- Page 609 and 610:
Maintenance Therapy for Myeloma: Ho
- Page 611 and 612:
MAINTENANCE THERAPY FOR MULTIPLE MY
- Page 613 and 614:
MAINTENANCE THERAPY FOR MULTIPLE MY
- Page 615 and 616:
MAINTENANCE THERAPY FOR MULTIPLE MY
- Page 617 and 618:
NEW OPTIONS, NEW QUESTIONS: HOW TO
- Page 619 and 620:
THERAPIES FOR PATIENTS WITH METASTA
- Page 621 and 622:
THERAPIES FOR PATIENTS WITH METASTA
- Page 623 and 624:
THERAPIES FOR PATIENTS WITH METASTA
- Page 625 and 626:
ANTIEMETICS: CURRENT STANDARDS, EME
- Page 627 and 628:
ANTIEMETICS: ASCO GUIDELINE UPDATE
- Page 629 and 630:
ANTIEMETICS: ASCO GUIDELINE UPDATE
- Page 631 and 632:
ANTIEMETICS: ASCO GUIDELINE UPDATE
- Page 633 and 634:
ANTIEMETICS: ASCO GUIDELINE UPDATE
- Page 635 and 636:
Chemotherapy-Induced Nausea and Vom
- Page 637 and 638:
INCIDENCE AND PREVALENCE OF CHEMOTH
- Page 639 and 640:
New Frontiers in Mucositis By Dougl
- Page 641 and 642:
MUCOSAL INJURY CAUSED BY CANCER THE
- Page 643 and 644:
MUCOSAL INJURY CAUSED BY CANCER THE
- Page 645 and 646:
MUCOSAL INJURY CAUSED BY CANCER THE
- Page 647 and 648:
Short- and Long-term Cardiovascular
- Page 649 and 650:
Recent Advances in Cardiotoxicity o
- Page 651 and 652:
CARDIOTOXICITY OF ANTICANCER THERAP
- Page 653 and 654:
CARDIOTOXICITY OF ANTICANCER THERAP
- Page 655 and 656:
The Oncologist as the Patient with
- Page 657 and 658:
THE ONCOLOGIST AS THE PATIENT OR RE
- Page 659 and 660:
Prolonged Febrile Neutropenia in th
- Page 661 and 662:
FEBRILE NEUTROPENIA IN PEDIATRIC CA
- Page 663 and 664:
FEBRILE NEUTROPENIA IN PEDIATRIC CA
- Page 665 and 666:
TREATMENT APPROACHES IN CHILDREN wh
- Page 667 and 668:
TREATMENT APPROACHES IN CHILDREN th
- Page 669 and 670:
GENETIC COUNSELING OF THE PATIENT W
- Page 671 and 672:
CANCER PREDISPOSITION IN CHILDHOOD
- Page 673 and 674:
CANCER PREDISPOSITION IN CHILDHOOD
- Page 675 and 676:
CANCER PREDISPOSITION IN CHILDHOOD
- Page 677 and 678:
CANCER PREDISPOSITION IN CHILDHOOD
- Page 679 and 680:
HOW TO MANAGE VERY RARE PEDIATRIC C
- Page 681 and 682:
RARE CANCER IN CHILDREN Registries
- Page 683 and 684:
Genetic Alterations in Childhood Me
- Page 685 and 686:
GENETIC ALTERATIONS IN CHILDHOOD ME
- Page 687 and 688:
Desmoid-Type Fibromatosis in Childr
- Page 689 and 690:
CHEMOTHERAPY FOR DESMOID TUMOR Tabl
- Page 691 and 692:
CHEMOTHERAPY FOR DESMOID TUMOR 14.
- Page 693 and 694:
Targeting the Insulin-Like Growth F
- Page 695 and 696:
TARGETING THE IGF SYSTEM Fig. 1. Th
- Page 697 and 698:
TARGETING THE IGF SYSTEM malignanci
- Page 699 and 700:
Hedgehog Pathway in Pediatric Cance
- Page 701 and 702:
HEDGEHOG PATHWAY IN PEDIATRIC CANCE
- Page 703 and 704:
HEDGEHOG PATHWAY IN PEDIATRIC CANCE
- Page 705 and 706:
Development and Refinement of Augme
- Page 707 and 708:
ABFM THERAPY FOR PEDIATRIC ALL than
- Page 709 and 710:
ABFM THERAPY FOR PEDIATRIC ALL Auth
- Page 711 and 712:
RADIOTHERAPY FOR PEDIATRIC HODGKIN
- Page 713 and 714:
RADIOTHERAPY FOR PEDIATRIC HODGKIN
- Page 715 and 716:
Role of Doxorubicin in Rhabdomyosar
- Page 717 and 718:
DOXORUBICIN IN RHABDOMYOSARCOMA 8.
- Page 719 and 720:
Identification of Novel Biologic Ta
- Page 721 and 722:
NOVEL TARGETS IN THE TREATMENT OF D
- Page 723 and 724:
Is Biopsy Safe in Children with New
- Page 725 and 726:
SAFETY OF DIPG BIOPSY IN CHILDREN F
- Page 727 and 728:
SAFETY OF DIPG BIOPSY IN CHILDREN 1
- Page 729 and 730:
CHILDREN WITH DIFFUSE INTRINSIC PON
- Page 731 and 732:
Communication and Decision Support
- Page 733 and 734:
COMMUNICATION AND DECISION SUPPORT
- Page 735 and 736:
COMMUNICATION AND DECISION SUPPORT
- Page 737 and 738:
COMMUNICATION AND DECISION SUPPORT
- Page 739 and 740:
Planning for the Future: The Role o
- Page 741 and 742:
present in the office suite but doe
- Page 743 and 744:
Summary and Care Plan are provided.
- Page 745 and 746:
DOING IT RIGHT, AND FOR LESS: IMPLE
- Page 747 and 748:
CLINICAL PATHWAYS STANDARDIZING PER
- Page 749 and 750:
CLINICAL PATHWAYS STANDARDIZING PER
- Page 751 and 752:
The Future of Oncology Care with Pe
- Page 753 and 754:
quantity. Determining the appropria
- Page 755 and 756:
THE ASCO QUALITY ONCOLOGY PRACTICE
- Page 757 and 758:
IMPROVING VALUE OF CARE IN ONCOLOGY
- Page 759 and 760:
IMPROVING VALUE OF CARE IN ONCOLOGY
- Page 761 and 762:
IMPROVING VALUE OF CARE IN ONCOLOGY
- Page 763 and 764:
PHYSICIAN WELLNESS: COPING WITH REP
- Page 765 and 766:
also provides insight on how clinic
- Page 767 and 768:
good resource for exploring the pri
- Page 769 and 770:
of death or following death and inc
- Page 771 and 772:
telephone call to the family, sendi
- Page 773 and 774:
New Insights in Cross-Cultural Comm
- Page 775 and 776:
CROSS-CULTURAL COMMUNICATION Sideba
- Page 777 and 778:
THE ONCOLOGIST, THE PATIENT, AND TH
- Page 779 and 780:
estimate of the proportion of their
- Page 781 and 782:
exactly the same treatment, even th
- Page 783 and 784:
How to Decide Whether to Offer and
- Page 785 and 786:
NONSTANDARD THERAPIES FOR ADVANCED
- Page 787 and 788:
NONSTANDARD THERAPIES FOR ADVANCED
- Page 789 and 790:
TARGETED THERAPIES IN TARGETED OR U
- Page 791 and 792:
TARGETED THERAPY IN SARCOMA rates a
- Page 793 and 794:
TARGETED THERAPY IN SARCOMA seen in
- Page 795 and 796:
TARGETED THERAPY IN SARCOMA recepto
- Page 797 and 798:
Adjuvant Treatment of Gastrointesti
- Page 799 and 800:
ADJUVANT THERAPY IN HIGH-RISK GASTR
- Page 801 and 802:
Management of Tyrosine Kinase Inhib
- Page 803 and 804:
TKI-RESISTANT GIST Primary Imatinib
- Page 805 and 806:
TKI-RESISTANT GIST Table 2. Clinica
- Page 807 and 808:
BIOLOGIC PRINCIPLES OF TARGETED COM
- Page 809 and 810:
COMBINING TARGETED AGENTS IN CLINIC
- Page 811 and 812:
COMBINING TARGETED AGENTS IN CLINIC
- Page 813 and 814:
Combination Therapies Building on t
- Page 815 and 816:
COMBINATIONS FOR MELANOMA agents th
- Page 817 and 818:
MECHANISMS OF RESISTANCE TO TARGETE
- Page 819 and 820:
RESISTANCE MECHANISMS TO MAPK INHIB
- Page 821 and 822:
RESISTANCE MECHANISMS TO MAPK INHIB
- Page 823 and 824:
Mechanisms of Resistance to Targete
- Page 825 and 826:
RESISTANCE TO TARGETED THERAPIES IN
- Page 827 and 828:
RESISTANCE TO TARGETED THERAPIES IN
- Page 829 and 830:
Translating PI3K-Delta Inhibitors t
- Page 831 and 832:
THE STORY OF CAL-101 6% of patients
- Page 833 and 834:
PI3 Kinase in Cancer: From Biology
- Page 835 and 836:
PI3 KINASE IN CANCER Fig. 1. The PI
- Page 837 and 838:
PI3 KINASE IN CANCER Fig. 3. In viv
- Page 840:
This publication is supported by an