- Page 1:
Institute for Health and Consumer P
- Page 4 and 5:
LEGAL NOTICE Neither the European C
- Page 7:
OVERVIEW This Technical Guidance Do
- Page 11 and 12:
CONTENTS 1 GENERAL INTRODUCTION ...
- Page 13 and 14:
4.2.3.4 Use of biodegradation scree
- Page 15 and 16:
1 GENERAL INTRODUCTION 1.1 BACKGROU
- Page 17 and 18:
GENERAL INTRODUCTION countries in t
- Page 19 and 20:
GENERAL INTRODUCTION PNEC is regard
- Page 21 and 22:
2 ENVIRONMENTAL EXPOSURE ASSESSMENT
- Page 23 and 24:
ENVIRONMENTAL EXPOSURE ASSESSMENT r
- Page 25 and 26:
2.2 MEASURED DATA ENVIRONMENTAL EXP
- Page 27 and 28:
ENVIRONMENTAL EXPOSURE ASSESSMENT w
- Page 29 and 30:
ENVIRONMENTAL EXPOSURE ASSESSMENT o
- Page 31 and 32:
ENVIRONMENTAL EXPOSURE ASSESSMENT T
- Page 33 and 34:
ENVIRONMENTAL EXPOSURE ASSESSMENT r
- Page 35 and 36:
Production ENVIRONMENTAL EXPOSURE A
- Page 37 and 38: Back to processing Product at end o
- Page 39 and 40: ENVIRONMENTAL EXPOSURE ASSESSMENT T
- Page 41 and 42: ENVIRONMENTAL EXPOSURE ASSESSMENT s
- Page 43 and 44: Explanation of symbols ENVIRONMENTA
- Page 45 and 46: ENVIRONMENTAL EXPOSURE ASSESSMENT s
- Page 47 and 48: ENVIRONMENTAL EXPOSURE ASSESSMENT U
- Page 49 and 50: ENVIRONMENTAL EXPOSURE ASSESSMENT a
- Page 51 and 52: ENVIRONMENTAL EXPOSURE ASSESSMENT F
- Page 53 and 54: 2.3.5.1 Adsorption to aerosol parti
- Page 55 and 56: ENVIRONMENTAL EXPOSURE ASSESSMENT I
- Page 57 and 58: 2.3.6.1 Hydrolysis ENVIRONMENTAL EX
- Page 59 and 60: 2.3.6.3 Photochemical reactions in
- Page 61 and 62: constant of zero. However, if it ca
- Page 63 and 64: ENVIRONMENTAL EXPOSURE ASSESSMENT A
- Page 65 and 66: ENVIRONMENTAL EXPOSURE ASSESSMENT T
- Page 67 and 68: ENVIRONMENTAL EXPOSURE ASSESSMENT a
- Page 69 and 70: Primary Settler Aeration Tank 2 5 3
- Page 71 and 72: Explanation of symbols ENVIRONMENTA
- Page 73 and 74: ENVIRONMENTAL EXPOSURE ASSESSMENT I
- Page 75 and 76: ENVIRONMENTAL EXPOSURE ASSESSMENT d
- Page 77 and 78: ENVIRONMENTAL EXPOSURE ASSESSMENT e
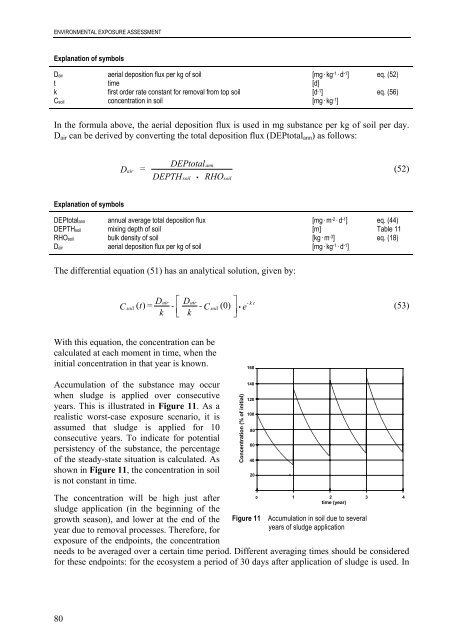
- Page 79 and 80: Table 10 Overview of different expo
- Page 81 and 82: ENVIRONMENTAL EXPOSURE ASSESSMENT -
- Page 83 and 84: 2.3.8.3 Calculation of PEClocal for
- Page 85 and 86: ENVIRONMENTAL EXPOSURE ASSESSMENT W
- Page 87: Guidance for calculating PEClocal i
- Page 91 and 92: Explanation of symbols ENVIRONMENTA
- Page 93 and 94: Calculation of PEClocalsoil For soi
- Page 95 and 96: ENVIRONMENTAL EXPOSURE ASSESSMENT
- Page 97 and 98: ENVIRONMENTAL EXPOSURE ASSESSMENT T
- Page 99 and 100: Output ENVIRONMENTAL EXPOSURE ASSES
- Page 101 and 102: 3 EFFECTS ASSESSMENT 3.1 INTRODUCTI
- Page 103 and 104: 3.2.1.1 Completeness of data New su
- Page 105 and 106: EFFECTS ASSESSMENT • it is clearl
- Page 107 and 108: EFFECTS ASSESSMENT 3.3 EFFECTS ASSE
- Page 109 and 110: Table 16 Assessment factors to deri
- Page 111 and 112: Input data EFFECTS ASSESSMENT The m
- Page 113 and 114: Estimation of the PNEC The PNEC is
- Page 115 and 116: EFFECTS ASSESSMENT biodegradability
- Page 117 and 118: Table 17 Test systems for derivatio
- Page 119 and 120: EFFECTS ASSESSMENT representative o
- Page 121 and 122: In the partitioning method, it is a
- Page 123 and 124: EFFECTS ASSESSMENT As mentioned in
- Page 125 and 126: 3.6.2.1 Calculation of PNEC using t
- Page 127 and 128: 3.7 EFFECTS ASSESSMENT FOR THE AIR
- Page 129 and 130: EFFECTS ASSESSMENT procedure availa
- Page 131 and 132: EFFECTS ASSESSMENT bioaccumulation
- Page 133 and 134: EFFECTS ASSESSMENT For some chemica
- Page 135 and 136: EFFECTS ASSESSMENT i.e. without enh
- Page 137 and 138: Conversion factors for laboratory a
- Page 139 and 140:
EFFECTS ASSESSMENT • relative sen
- Page 141 and 142:
EFFECTS ASSESSMENT Earthworms are a
- Page 143 and 144:
MARINE RISK ASSESSMENT environment
- Page 145 and 146:
MARINE RISK ASSESSMENT of equal rel
- Page 147 and 148:
4.2.3.3 Marine biodegradation simul
- Page 149 and 150:
MARINE RISK ASSESSMENT In addition
- Page 151 and 152:
Explanation of symbols MARINE RISK
- Page 153 and 154:
MARINE RISK ASSESSMENT evaluate the
- Page 155 and 156:
MARINE RISK ASSESSMENT marine water
- Page 157 and 158:
MARINE RISK ASSESSMENT The addition
- Page 159 and 160:
MARINE RISK ASSESSMENT Statistical
- Page 161 and 162:
MARINE RISK ASSESSMENT sediment, fo
- Page 163 and 164:
Table 27 Assessment factors for der
- Page 165 and 166:
Table 28 continued Acute and chroni
- Page 167 and 168:
MARINE RISK ASSESSMENT of different
- Page 169 and 170:
MARINE RISK ASSESSMENT • a measur
- Page 171 and 172:
MARINE RISK ASSESSMENT b. the conce
- Page 173 and 174:
MARINE RISK ASSESSMENT mechanisms s
- Page 175 and 176:
MARINE RISK ASSESSMENT The use of t
- Page 177 and 178:
4.4.4.2 Assessment of measured BCF
- Page 179 and 180:
MARINE RISK ASSESSMENT required to
- Page 181 and 182:
Table 33 Overview of PEC/PNEC ratio
- Page 183 and 184:
RISK CHARACTERISATION If a refineme
- Page 185 and 186:
Classified dangerous to the Environ
- Page 187 and 188:
RISK CHARACTERISATION eaters. This
- Page 189 and 190:
6 TESTING STRATEGIES 6.1 INTRODUCTI
- Page 191 and 192:
TESTING STRATEGIES Performance of a
- Page 193 and 194:
TESTING STRATEGIES Care must be tak
- Page 195 and 196:
Algal testing Algae toxicity test (
- Page 197 and 198:
TESTING STRATEGIES • long-term te
- Page 199 and 200:
Microbial assays TESTING STRATEGIES
- Page 201 and 202:
TESTING STRATEGIES A soil bioassay
- Page 203 and 204:
REFERENCES Brandes LJ, den Hollande
- Page 205 and 206:
REFERENCES IPCS (2000). Framework f
- Page 207 and 208:
REFERENCES OECD (1984f). Activated
- Page 209 and 210:
REFERENCES Pack S. (1993). A review
- Page 211:
REFERENCES US EPA (1996). Whole Sed
- Page 214 and 215:
APPENDIX I volume imported in the E
- Page 216 and 217:
APPENDIX I MC IV “Wide dispersive
- Page 218 and 219:
APPENDIX I 210 Stage Main category
- Page 220 and 221:
APPENDIX I the number of days over
- Page 222 and 223:
APPENDIX I Stage Main category Ia I
- Page 224 and 225:
APPENDIX I manufacturing of motor c
- Page 226 and 227:
APPENDIX I 1. extension of the tabl
- Page 228 and 229:
APPENDIX I 220 A-tables Estimates f
- Page 230 and 231:
APPENDIX I PRIVATE USE Not applicab
- Page 232 and 233:
APPENDIX I IC = 3: CHEMICAL INDUSTR
- Page 234 and 235:
APPENDIX I IC = 5: PERSONAL /DOMEST
- Page 236 and 237:
APPENDIX I Table A4.1 continued Com
- Page 238 and 239:
APPENDIX I IC = 7: LEATHER PROCESSI
- Page 240 and 241:
APPENDIX I IC = 9: MINERAL OIL AND
- Page 242 and 243:
APPENDIX I WASTE TREATMENT Table A5
- Page 244 and 245:
APPENDIX I For the emission factors
- Page 246 and 247:
APPENDIX I INDUSTRIAL USE Table A3.
- Page 248 and 249:
APPENDIX I INDUSTRIAL USE Table A3.
- Page 250 and 251:
APPENDIX I PRIVATE USE Table A4.5 C
- Page 252 and 253:
APPENDIX I PRIVATE USE Table A3.16
- Page 254 and 255:
APPENDIX I 246 B-tables Estimates f
- Page 256 and 257:
APPENDIX I FORMULATION Table B2.2 f
- Page 258 and 259:
APPENDIX I IC = 3: CHEMICAL INDUSTR
- Page 260 and 261:
APPENDIX I IC = 5: PERSONAL/DOMESTI
- Page 262 and 263:
APPENDIX I IC = 7: LEATHER PROCESSI
- Page 264 and 265:
APPENDIX I IC = 9: MINERAL OIL AND
- Page 266 and 267:
APPENDIX I IC = 11: POLYMERS INDUST
- Page 268 and 269:
APPENDIX I IC =13: TEXTILE PROCESSI
- Page 270 and 271:
APPENDIX I IC = 16: ENGINEERING IND
- Page 272 and 273:
APPENDIX I Appendix I-a: List of sy
- Page 274 and 275:
APPENDIX I No. Use Category No. Fun
- Page 276 and 277:
APPENDIX I No. Use Category No. Fun
- Page 278 and 279:
APPENDIX I No. Use Category No. Fun
- Page 280 and 281:
APPENDIX I Appendix I-b: List of sy
- Page 282 and 283:
APPENDIX I 290 Organic intermediate
- Page 284 and 285:
APPENDIX I Other IC/UC combinations
- Page 286 and 287:
APPENDIX II Appendix II Fate of che
- Page 288 and 289:
APPENDIX II b) Inherent biodegradab
- Page 290 and 291:
APPENDIX II log H % removal -4 -3 -
- Page 292 and 293:
APPENDIX III Appendix III Evaluatio
- Page 294 and 295:
APPENDIX III Field studies In gener
- Page 296 and 297:
APPENDIX IV together the mentioned
- Page 298 and 299:
290 Table 1 Selected soil test meth
- Page 300 and 301:
292 Table 1 continued Selected soil
- Page 302 and 303:
294 Table 1 continued Selected soil
- Page 304 and 305:
296 Table 1 continued Selected soil
- Page 306 and 307:
298 Table 1 Selected freshwater sed
- Page 308 and 309:
APPENDIX VII Appendix VII Toxicity
- Page 310 and 311:
APPENDIX VIII collection), and that
- Page 312 and 313:
APPENDIX VIII chemicals (see Sectio
- Page 314 and 315:
APPENDIX VIII Multimedia fate model
- Page 316 and 317:
APPENDIX VIII Monitoring data Metal
- Page 318 and 319:
APPENDIX VIII homeostatic regulatio
- Page 320 and 321:
APPENDIX IX based on the proportion
- Page 322 and 323:
APPENDIX IX Definition of “blocks
- Page 324 and 325:
APPENDIX IX these “blocks” will
- Page 326 and 327:
APPENDIX IX and PNECs for the “bl
- Page 328 and 329:
APPENDIX XI Appendix XI Environment
- Page 330 and 331:
APPENDIX XII Appendix XII Connectio
- Page 332 and 333:
APPENDIX XII +40% compared to 1992.
- Page 334 and 335:
APPENDIX XIII other substance is be
- Page 336 and 337:
APPENDIX XIV Taxonomic group No. of