technical guidance documents - Institute for Health and Consumer ...
technical guidance documents - Institute for Health and Consumer ...
technical guidance documents - Institute for Health and Consumer ...

You also want an ePaper? Increase the reach of your titles
YUMPU automatically turns print PDFs into web optimized ePapers that Google loves.
ENVIRONMENTAL EXPOSURE ASSESSMENT<br />
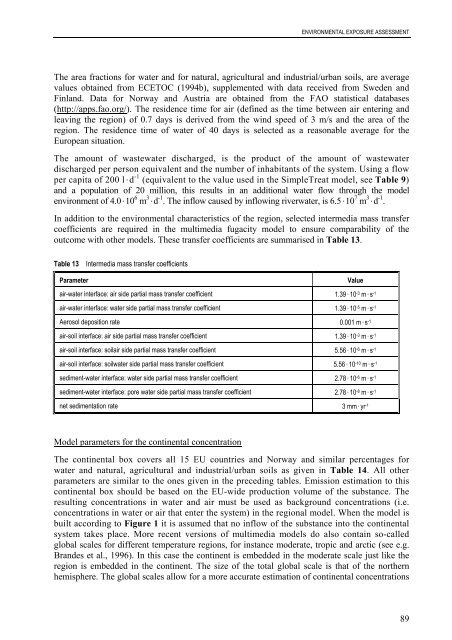
The area fractions <strong>for</strong> water <strong>and</strong> <strong>for</strong> natural, agricultural <strong>and</strong> industrial/urban soils, are average<br />
values obtained from ECETOC (1994b), supplemented with data received from Sweden <strong>and</strong><br />
Finl<strong>and</strong>. Data <strong>for</strong> Norway <strong>and</strong> Austria are obtained from the FAO statistical databases<br />
(http://apps.fao.org/). The residence time <strong>for</strong> air (defined as the time between air entering <strong>and</strong><br />
leaving the region) of 0.7 days is derived from the wind speed of 3 m/s <strong>and</strong> the area of the<br />
region. The residence time of water of 40 days is selected as a reasonable average <strong>for</strong> the<br />
European situation.<br />
The amount of wastewater discharged, is the product of the amount of wastewater<br />
discharged per person equivalent <strong>and</strong> the number of inhabitants of the system. Using a flow<br />
per capita of 200 l .d -1 (equivalent to the value used in the SimpleTreat model, see Table 9)<br />
<strong>and</strong> a population of 20 million, this results in an additional water flow through the model<br />
environment of 4.0 .10 6 m 3 .d -1 . The inflow caused by inflowing riverwater, is 6.5 .10 7 m 3 .d -1 .<br />
In addition to the environmental characteristics of the region, selected intermedia mass transfer<br />
coefficients are required in the multimedia fugacity model to ensure comparability of the<br />
outcome with other models. These transfer coefficients are summarised in Table 13.<br />
Table 13 Intermedia mass transfer coefficients<br />
Parameter Value<br />
air-water interface: air side partial mass transfer coefficient 1.39 . 10 -3 m . s -1<br />
air-water interface: water side partial mass transfer coefficient 1.39 . 10 -5 m . s -1<br />
Aerosol deposition rate 0.001 m . s -1<br />
air-soil interface: air side partial mass transfer coefficient 1.39 . 10 -3 m . s -1<br />
air-soil interface: soilair side partial mass transfer coefficient 5.56 . 10 -6 m . s -1<br />
air-soil interface: soilwater side partial mass transfer coefficient 5.56 . 10 -10 m . s -1<br />
sediment-water interface: water side partial mass transfer coefficient 2.78 . 10 -6 m . s -1<br />
sediment-water interface: pore water side partial mass transfer coefficient 2.78 . 10 -8 m . s -1<br />
net sedimentation rate 3 mm . yr -1<br />
Model parameters <strong>for</strong> the continental concentration<br />
The continental box covers all 15 EU countries <strong>and</strong> Norway <strong>and</strong> similar percentages <strong>for</strong><br />
water <strong>and</strong> natural, agricultural <strong>and</strong> industrial/urban soils as given in Table 14. All other<br />
parameters are similar to the ones given in the preceding tables. Emission estimation to this<br />
continental box should be based on the EU-wide production volume of the substance. The<br />
resulting concentrations in water <strong>and</strong> air must be used as background concentrations (i.e.<br />
concentrations in water or air that enter the system) in the regional model. When the model is<br />
built according to Figure 1 it is assumed that no inflow of the substance into the continental<br />
system takes place. More recent versions of multimedia models do also contain so-called<br />
global scales <strong>for</strong> different temperature regions, <strong>for</strong> instance moderate, tropic <strong>and</strong> arctic (see e.g.<br />
Br<strong>and</strong>es et al., 1996). In this case the continent is embedded in the moderate scale just like the<br />
region is embedded in the continent. The size of the total global scale is that of the northern<br />
hemisphere. The global scales allow <strong>for</strong> a more accurate estimation of continental concentrations<br />
89