Trade and Employment From Myths to Facts - International Labour ...
Trade and Employment From Myths to Facts - International Labour ...
Trade and Employment From Myths to Facts - International Labour ...
Create successful ePaper yourself
Turn your PDF publications into a flip-book with our unique Google optimized e-Paper software.
<strong>Trade</strong> <strong>and</strong> <strong>Employment</strong>: <strong>From</strong> <strong>Myths</strong> <strong>to</strong> <strong>Facts</strong><br />
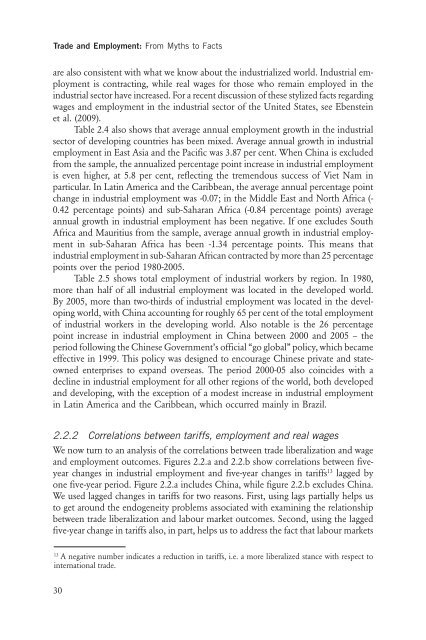
are also consistent with what we know about the industrialized world. Industrial employment<br />
is contracting, while real wages for those who remain employed in the<br />
industrial sec<strong>to</strong>r have increased. For a recent discussion of these stylized facts regarding<br />
wages <strong>and</strong> employment in the industrial sec<strong>to</strong>r of the United States, see Ebenstein<br />
et al. (2009).<br />
Table 2.4 also shows that average annual employment growth in the industrial<br />
sec<strong>to</strong>r of developing countries has been mixed. Average annual growth in industrial<br />
employment in East Asia <strong>and</strong> the Pacific was 3.87 per cent. When China is excluded<br />
from the sample, the annualized percentage point increase in industrial employment<br />
is even higher, at 5.8 per cent, reflecting the tremendous success of Viet Nam in<br />
particular. In Latin America <strong>and</strong> the Caribbean, the average annual percentage point<br />
change in industrial employment was -0.07; in the Middle East <strong>and</strong> North Africa (-<br />
0.42 percentage points) <strong>and</strong> sub-Saharan Africa (-0.84 percentage points) average<br />
annual growth in industrial employment has been negative. If one excludes South<br />
Africa <strong>and</strong> Mauritius from the sample, average annual growth in industrial employment<br />
in sub-Saharan Africa has been -1.34 percentage points. This means that<br />
industrial employment in sub-Saharan African contracted by more than 25 percentage<br />
points over the period 1980-2005.<br />
Table 2.5 shows <strong>to</strong>tal employment of industrial workers by region. In 1980,<br />
more than half of all industrial employment was located in the developed world.<br />
By 2005, more than two-thirds of industrial employment was located in the developing<br />
world, with China accounting for roughly 65 per cent of the <strong>to</strong>tal employment<br />
of industrial workers in the developing world. Also notable is the 26 percentage<br />
point increase in industrial employment in China between 2000 <strong>and</strong> 2005 – the<br />
period following the Chinese Government’s official “go global” policy, which became<br />
effective in 1999. This policy was designed <strong>to</strong> encourage Chinese private <strong>and</strong> stateowned<br />
enterprises <strong>to</strong> exp<strong>and</strong> overseas. The period 2000-05 also coincides with a<br />
decline in industrial employment for all other regions of the world, both developed<br />
<strong>and</strong> developing, with the exception of a modest increase in industrial employment<br />
in Latin America <strong>and</strong> the Caribbean, which occurred mainly in Brazil.<br />
2.2.2 Correlations between tariffs, employment <strong>and</strong> real wages<br />
We now turn <strong>to</strong> an analysis of the correlations between trade liberalization <strong>and</strong> wage<br />
<strong>and</strong> employment outcomes. Figures 2.2.a <strong>and</strong> 2.2.b show correlations between fiveyear<br />
changes in industrial employment <strong>and</strong> five-year changes in tariffs13 lagged by<br />
one five-year period. Figure 2.2.a includes China, while figure 2.2.b excludes China.<br />
We used lagged changes in tariffs for two reasons. First, using lags partially helps us<br />
<strong>to</strong> get around the endogeneity problems associated with examining the relationship<br />
between trade liberalization <strong>and</strong> labour market outcomes. Second, using the lagged<br />
five-year change in tariffs also, in part, helps us <strong>to</strong> address the fact that labour markets<br />
13 A negative number indicates a reduction in tariffs, i.e. a more liberalized stance with respect <strong>to</strong><br />
international trade.<br />
30


