- Page 1 and 2:
REVISION OF PASSIFLORA SUBGENUS DEC
- Page 3 and 4:
ACKNOWLEDGMENTS This study was supp
- Page 5 and 6:
of Florida Herbarium, Florida Museu
- Page 7 and 8:
esources to this project. Walter Ju
- Page 9 and 10:
Distribution and Ecology ..........
- Page 11 and 12:
Description of Passiflora tacana...
- Page 13 and 14:
7.2. Table indicating the type and
- Page 15 and 16:
3.15. Box plots of character 2 (sti
- Page 17 and 18:
3.47. Box plots of character 34 (le
- Page 19 and 20:
8.19. Flower of P. trinifolia (MacD
- Page 21 and 22:
Abstract of Dissertation Presented
- Page 23 and 24:
CHAPTER 1 INTRODUCTION Passiflora L
- Page 25 and 26:
3 Species Plantarum, taxonomists ha
- Page 27 and 28:
CHAPTER 2 TAXONOMIC HISTORY The gen
- Page 29 and 30:
the limen floor possessed five spot
- Page 31 and 32:
Cieca: Passiflora foliis indivisis
- Page 33 and 34:
11 of the species with dish-shaped
- Page 35 and 36:
13 species of supersection Cieca th
- Page 37 and 38:
15 the International Botanical Cong
- Page 39 and 40:
17 conventions in Fig. 3.1-3.3. The
- Page 41 and 42:
19 Figure 3.4. View of flower of Pa
- Page 43 and 44:
21 Figure 3.6. View of a longitudin
- Page 45 and 46:
23 repository of foreign place-name
- Page 47 and 48:
25 The ITS region for members of su
- Page 49 and 50:
(Donoghue, 1985; Mishler, 1985) spe
- Page 51 and 52:
Figure 3.8. Box plots of character
- Page 53 and 54: Figure 3.10. Box plots of character
- Page 55 and 56: Figure 3.12. Box plots of character
- Page 57 and 58: Figure 3.14. Box plots of character
- Page 59 and 60: Figure 3.16. Box plots of character
- Page 61 and 62: Figure 3.18. Box plots of character
- Page 63 and 64: Figure 3.20. Box plots of character
- Page 65 and 66: Figure 3.22. Box plots of character
- Page 67 and 68: Figure 3.24. Box plots of character
- Page 69 and 70: Figure 3.26. Box plots of character
- Page 71 and 72: Figure 3.28. Box plots of character
- Page 73 and 74: Figure 3.30. Box plots of character
- Page 75 and 76: Figure 3.32. Box plots of character
- Page 77 and 78: Figure 3.34. Box plots of character
- Page 79 and 80: Figure 3.36. Box plots of character
- Page 81 and 82: Figure 3.38. Box plots of character
- Page 83 and 84: Figure 3.40. Box plots of character
- Page 85 and 86: Figure 3.42. Box plots of character
- Page 87 and 88: Figure 3.44. Box plots of character
- Page 89 and 90: Figure 3.46. Box plots of character
- Page 91 and 92: Figure 3.48. Box plots of character
- Page 93 and 94: Figure 3.50. Box plots of character
- Page 95 and 96: Figure 3.52. Box plots of character
- Page 97 and 98: obtusifolia (50% bootstrap), and P.
- Page 99 and 100: 77 Figure 4.1. The first of three m
- Page 101 and 102: 79 Figure 4.3. The third of three m
- Page 103: 81 Figure 4.5. A portion of the str
- Page 107 and 108: 85 clusters of P. suberosa ssp. lit
- Page 109 and 110: Figure 5.1. Principal components an
- Page 111 and 112: Table 5.2. Cont. Variables PCI PCII
- Page 113 and 114: 91 Table 5.3. Component loadings fo
- Page 115 and 116: Table 5.4. Cont. 93 29. Seed width
- Page 117 and 118: Table 5.5. Character values used in
- Page 119 and 120: 97 Figure 5.3. Unrooted neighbor jo
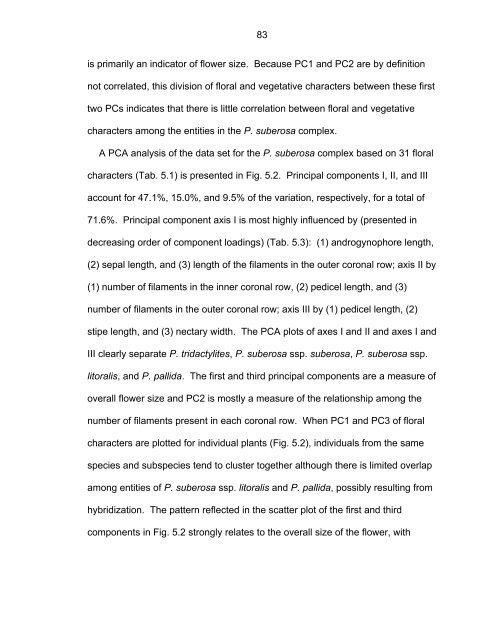
- Page 121 and 122: 70.1%. Principal component axis I i
- Page 123 and 124: 101 Figure 5.4. Principal component
- Page 125 and 126: Table 5.7. Cont. 103 Variables PCI
- Page 127 and 128: 105 Table 5.8. Component loadings f
- Page 129 and 130: Table 5.9. Cont. 107 30. Distance f
- Page 131 and 132: 109 Figure 5.6. Unrooted neighbor j
- Page 133 and 134: 111 mm long (#13, 1), and 0-2 flora
- Page 135 and 136: 113 the nodes as well as in inflore
- Page 137 and 138: 115 (0.13-0.14 mm in height)(#22, 3
- Page 139 and 140: 117 mm in length (#26, 1), and the
- Page 141 and 142: 119 longer than the central veins (
- Page 143 and 144: 121 that are between 0.25 and 0.72
- Page 145 and 146: Table 6.1. Cont. 123 27. Seed width
- Page 147 and 148: Table 6.1. Cont. 125 74. Limen whit
- Page 149 and 150: Table 6.2. Character values for tax
- Page 151 and 152: 129 Figure 6.2. The single most par
- Page 153 and 154: 131 the molecular study was not fea
- Page 155 and 156:
133 are considered sibling species,
- Page 157 and 158:
135 The Passiflora coriacea Complex
- Page 159 and 160:
137 The Passiflora suberosa Complex
- Page 161 and 162:
139 morphological analysis. Passifl
- Page 163 and 164:
141 supported P. pallida clade and
- Page 165 and 166:
143 clear that these processes have
- Page 167 and 168:
145 semierect to erect flowers with
- Page 169 and 170:
147 protect nectar from rain, desic
- Page 171 and 172:
149 Passiflora is not necessarily d
- Page 173 and 174:
151 and P. sexocellata in the molec
- Page 175 and 176:
Table 7.1. Cont. Species Heliconiin
- Page 177 and 178:
155 result of introduction by human
- Page 179 and 180:
157 the dry tropical forests typica
- Page 181 and 182:
159 There are two primary types of
- Page 183 and 184:
161 ocean. However, I do know of on
- Page 185 and 186:
163 all of the species in supersect
- Page 187 and 188:
165 plants, suggesting that a crite
- Page 189 and 190:
167 Lastly, the utilization of only
- Page 191 and 192:
169 central part of the inflorescen
- Page 193 and 194:
171 25): Cieca viridis Medik. [nom.
- Page 195 and 196:
173 trichomes; styles slender, less
- Page 197 and 198:
175 7. Laminar nectaries absent; le
- Page 199 and 200:
177 11. Androgynophore less than 11
- Page 201 and 202:
179 15. Outer coronal filaments gre
- Page 203 and 204:
181 22. Central vein length more th
- Page 205 and 206:
183 Slender, climbing, perennial vi
- Page 207 and 208:
185 greenish yellow with a flush of
- Page 209 and 210:
187 Antigua, Wullschlager 240 (M).
- Page 211 and 212:
189 Waterloo, Degener 18853 (GH, NY
- Page 213 and 214:
191 29 (NY); San Andrés Island, al
- Page 215 and 216:
193 ISLA DE JUVENTUD: Nueva Gerona,
- Page 217 and 218:
195 (B). Dominican Republic. -BAORU
- Page 219 and 220:
197 Exploration Company a las Merce
- Page 221 and 222:
199 120-140 m, Wallnöfer & Tut-Tes
- Page 223 and 224:
201 Howard & Proctor 13477 (A); Mid
- Page 225 and 226:
203 sobre el camino a San Gervacio,
- Page 227 and 228:
205 Chelem, unos 3-5 km W de Progre
- Page 229 and 230:
207 Vista, Standley 25357 (US); Nue
- Page 231 and 232:
209 Ganoruwa Hill, Peradeniya, Kand
- Page 233 and 234:
211 Lakela 31283 (MIN); Lagoon emba
- Page 235 and 236:
213 Park, Gillis 11503 (A); Homeste
- Page 237 and 238:
215 Mosier 5511 (NY); Adams Key, Sm
- Page 239 and 240:
217 Road"), 4 mi. W of Miami-Dade-M
- Page 241 and 242:
219 Wildlife Refuge S of Alamo, Fle
- Page 243 and 244:
221 Figure 8.3. Distribution of Pas
- Page 245 and 246:
223 labeled P. pallida, but it is a
- Page 247 and 248:
225 the entities in the P. suberosa
- Page 249 and 250:
227 Quintana Roo, México; and J. T
- Page 251 and 252:
Description of Passiflora suberosa
- Page 253 and 254:
231 3.1 mm in diameter, greenish ye
- Page 255 and 256:
233 operculum, 0.1-0.7 mm high, 0.1
- Page 257 and 258:
235 0.06-0.10 mm long, 0.02-0.03 mm
- Page 259 and 260:
237 near Museum, Sarant, Saums & Wa
- Page 261 and 262:
239 (about 1.5 km up from mouth of
- Page 263 and 264:
241 Vieux-Fort, Mts. Caraibes, en b
- Page 265 and 266:
243 BAYAMÓN: Cabra Island, San Jua
- Page 267 and 268:
245 15 February 1906 (C). -SAINT TH
- Page 269 and 270:
247 Figure 8.5. Flower of P. subero
- Page 271 and 272:
249 possesses trilobed leaves at re
- Page 273 and 274:
251 Passiflora suberosa ssp. subero
- Page 275 and 276:
253 and ovoid, whereas P. suberosa
- Page 277 and 278:
255 Passiflora suberosa L. var. hir
- Page 279 and 280:
Distribution and ecology 257 In the
- Page 281 and 282:
259 Morrone & Pensiero 6320 (MO). -
- Page 283 and 284:
261 Hatschbach 52826 (C); Agua Bran
- Page 285 and 286:
263 & Brand 2059b (MA); Entre Filad
- Page 287 and 288:
265 Restrepo, Vereda del Río Grand
- Page 289 and 290:
267 UC, US). French Overseas Territ
- Page 291 and 292:
269 River near Sahal K'esh, paraje
- Page 293 and 294:
271 Matuda & sus colaboradores 3160
- Page 295 and 296:
273 800 m, Arguelles 909 (CAS); 4-5
- Page 297 and 298:
275 antes de Aculizingo, rumbo a Or
- Page 299 and 300:
277 Sagastegui, Alvitaz, Carnia, Lo
- Page 301 and 302:
279 Osores, Figari, Díaz, Castaned
- Page 303 and 304:
281 between Sabana Grande and Barut
- Page 305 and 306:
283 shallowly trilobed leaves (comm
- Page 307 and 308:
285 a b c Figure 8.8. Flowers of Pa
- Page 309 and 310:
Description of Passiflora tridactyl
- Page 311 and 312:
289 yellow, ratio of inner coronal
- Page 313 and 314:
Notes 291 Passiflora tridactylites
- Page 315 and 316:
293 suberosa ssp. litoralis do not
- Page 317 and 318:
Description of Passiflora lancifoli
- Page 319 and 320:
297 light reddish purple dried; and
- Page 321 and 322:
299 which he called P. regalis, now
- Page 323 and 324:
301 Additionally, the habitats of b
- Page 325 and 326:
303 Figure 8.13. Distribution of P.
- Page 327 and 328:
305 of sepals reflexed at anthesis;
- Page 329 and 330:
307 regalis in his unpublished Flor
- Page 331 and 332:
309 Figure 8.14. Leaves and flowers
- Page 333 and 334:
311 abaxial surface, 0.6-0.9 mm in
- Page 335 and 336:
313 S of Monclova, Dorr & Atkins 22
- Page 337 and 338:
315 E side of Sullivan City, Correl
- Page 339 and 340:
317 Noyes 5670 (DUKE, TEX); Rocky c
- Page 341 and 342:
319 longer filaments in their coron
- Page 343 and 344:
Description of Passiflora eglandulo
- Page 345 and 346:
323 filaments at anthesis; styles 3
- Page 347 and 348:
325 road between San Marcos and San
- Page 349 and 350:
327 Passiflora eglandulosa is also
- Page 351 and 352:
329 Figure 8.18. Distribution of P.
- Page 353 and 354:
331 mm long, 0.4-0.5 mm wide, linea
- Page 355 and 356:
333 Figure 8.19. Flower of P. trini
- Page 357 and 358:
335 dried; androgynophore 3.8 mm lo
- Page 359 and 360:
Notes 337 Passiflora clypeophylla i
- Page 361 and 362:
339 wide; petioles 0.5-2.8 cm long,
- Page 363 and 364:
341 Oaxaca. Tropical deciduous and
- Page 365 and 366:
343 vegetatively with their distinc
- Page 367 and 368:
345 with rounded edges, greenish ye
- Page 369 and 370:
347 marked with ca. 11-18 foveae. G
- Page 371 and 372:
349 flowers of this plant. In an un
- Page 373 and 374:
351 Figure 8.24. Distribution of P.
- Page 375 and 376:
353 often red (4/12) at flowering n
- Page 377 and 378:
355 shrubs, small trees, boulders a
- Page 379 and 380:
357 carretera a Acapulco, 240 m, He
- Page 381 and 382:
359 McCormick (1982) chromatographi
- Page 383 and 384:
361 Passiflora mcvaughiana Descript
- Page 385 and 386:
363 diameter, whitish green, speckl
- Page 387 and 388:
365 mcvaughiana possesses the wides
- Page 389 and 390:
367 Figure 8.28. Fruit and seeds of
- Page 391 and 392:
369 2.1 mm thick, acute at both end
- Page 393 and 394:
371 Figure 8.30. Habit of P. tacana
- Page 395 and 396:
373 Passiflora cheiroptera Cortés,
- Page 397 and 398:
375 4/6) spots and streaks; androgy
- Page 399 and 400:
377 Manizales, 1500 m, Escobar & Ur
- Page 401 and 402:
379 Yotoco, hacienda San Martín po
- Page 403 and 404:
381 5491 (MO); Juanjuí, 400 m, Woy
- Page 405 and 406:
383 differences in the stipe and pe
- Page 407 and 408:
385 Passiflora megacoriacea Descrip
- Page 409 and 410:
387 with stipe 2.6-6.1 mm long, 0.9
- Page 411 and 412:
389 59c (MO); Rincón de la Vieja,
- Page 413 and 414:
391 vicinity of Panamá Railroad cr
- Page 415 and 416:
393 Passiflora megacoriacea, as not
- Page 417 and 418:
395 weight to be 29-44% in P. megac
- Page 419 and 420:
397 veins, 0.5-1.4 mm in diameter,
- Page 421 and 422:
Vernacular Names 399 Ala de murcié
- Page 423 and 424:
401 Blake 7595 (US); Cadenas, borde
- Page 425 and 426:
403 Carrizal, 550 m, Williams & Mol
- Page 427 and 428:
405 Coatzacoalcos, Coatzacoalcos, e
- Page 429 and 430:
407 published. It is interesting th
- Page 431 and 432:
409 petiolar nectaries at or near t
- Page 433 and 434:
Description of Passiflora itzensis
- Page 435 and 436:
413 very dark reddish purple, ratio
- Page 437 and 438:
415 species from other members of s
- Page 439 and 440:
417 Figure 8.37. Distribution of P.
- Page 441 and 442:
419 leaf axils or inflorescences; i
- Page 443 and 444:
421 ruins), 600-700 ft., Proctor 29
- Page 445 and 446:
423 vegetatively identical to P. it
- Page 447 and 448:
425 DNA polymerase (Sigma-Aldrich;
- Page 449 and 450:
427 Figure A.1. Structure of portio
- Page 451 and 452:
429 agree in several ways: 1) there
- Page 453 and 454:
431 Figure A.1. The first of 124 mo
- Page 455 and 456:
LIST OF REFERENCES Bat Conservation
- Page 457 and 458:
435 Falling Rain Genomics, Inc. Glo
- Page 459 and 460:
437 Jussieu, A.L. de. 1805b. Second
- Page 461 and 462:
439 Masters, M.T. 1871. Contributio
- Page 463 and 464:
441 National Imagery and Mapping Ag
- Page 465 and 466:
443 Stevens, P.F. 1991. Character s