Mathematics in Independent Component Analysis
Mathematics in Independent Component Analysis
Mathematics in Independent Component Analysis
You also want an ePaper? Increase the reach of your titles
YUMPU automatically turns print PDFs into web optimized ePapers that Google loves.
PSfrag replacements<br />
PSfrag replacements<br />
f quadratic ICA for n = 2<br />
PSfrag replacements<br />
f quadratic ICA for n = 2<br />
f quadratic ICA for n = 3<br />
Chapter 5. IEICE TF E87-A(9):2355-2363, 2004 111<br />
8<br />
Mean SNR (dB)<br />
Mean SNR (dB)<br />
Mean SNR (dB)<br />
45<br />
40<br />
35<br />
30<br />
25<br />
20<br />
15<br />
10<br />
Performance of quadratic ICA for n = 2<br />
Bil<strong>in</strong>ear ICA<br />
L<strong>in</strong>ear ICA<br />
5<br />
0 2000 4000 6000 8000 10000 12000<br />
Number of samples<br />
Performance of quadratic ICA for n = 3<br />
35<br />
Bil<strong>in</strong>ear ICA<br />
L<strong>in</strong>ear ICA<br />
30<br />
25<br />
20<br />
15<br />
10<br />
5<br />
0 2000 4000 6000 8000 10000 12000<br />
Number of samples<br />
Performance of quadratic ICA for n = 4<br />
30<br />
Bil<strong>in</strong>ear ICA<br />
L<strong>in</strong>ear ICA<br />
25<br />
20<br />
15<br />
10<br />
5<br />
0 2000 4000 6000<br />
Number of samples<br />
8000 10000 12000<br />
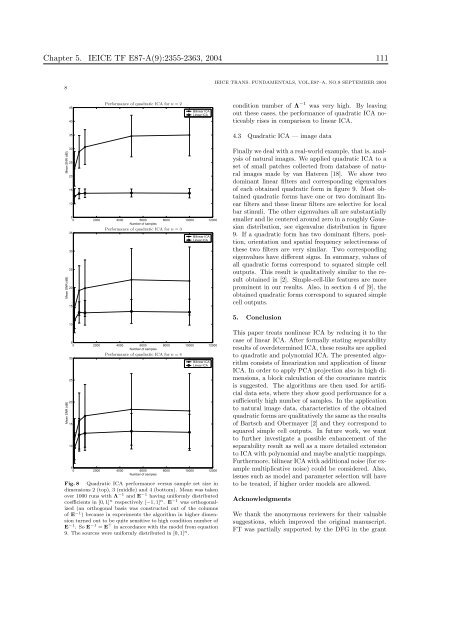
Fig. 8 Quadratic ICA performance versus sample set size <strong>in</strong><br />
dimensions 2 (top), 3 (middle) and 4 (bottom). Mean was taken<br />
over 1000 runs with Λ −1 and E −1 hav<strong>in</strong>g uniformly distributed<br />
coefficients <strong>in</strong> [0, 1] n respectively [−1, 1] n . E −1 was orthogonalized<br />
(an orthogonal basis was constructed out of the columns<br />
of E −1 ) because <strong>in</strong> experiments the algorithm <strong>in</strong> higher dimension<br />
turned out to be quite sensitive to high condition number of<br />
E −1 . So E −1 = E ⊤ <strong>in</strong> accordance with the model from equation<br />
9. The sources were uniformly distributed <strong>in</strong> [0, 1] n .<br />
IEICE TRANS. FUNDAMENTALS, VOL.E87–A, NO.9 SEPTEMBER 2004<br />
condition number of Λ −1 was very high. By leav<strong>in</strong>g<br />
out these cases, the performance of quadratic ICA noticeably<br />
rises <strong>in</strong> comparison to l<strong>in</strong>ear ICA.<br />
4.3 Quadratic ICA — image data<br />
F<strong>in</strong>ally we deal with a real-world example, that is, analysis<br />
of natural images. We applied quadratic ICA to a<br />
set of small patches collected from database of natural<br />
images made by van Hateren [18]. We show two<br />
dom<strong>in</strong>ant l<strong>in</strong>ear filters and correspond<strong>in</strong>g eigenvalues<br />
of each obta<strong>in</strong>ed quadratic form <strong>in</strong> figure 9. Most obta<strong>in</strong>ed<br />
quadratic forms have one or two dom<strong>in</strong>ant l<strong>in</strong>ear<br />
filters and these l<strong>in</strong>ear filters are selective for local<br />
bar stimuli. The other eigenvalues all are substantially<br />
smaller and lie centered around zero <strong>in</strong> a roughly Gaussian<br />
distribution, see eigenvalue distribution <strong>in</strong> figure<br />
9. If a quadratic form has two dom<strong>in</strong>ant filters, position,<br />
orientation and spatial frequency selectiveness of<br />
these two filters are very similar. Two correspond<strong>in</strong>g<br />
eigenvalues have different signs. In summary, values of<br />
all quadratic forms correspond to squared simple cell<br />
outputs. This result is qualitatively similar to the result<br />
obta<strong>in</strong>ed <strong>in</strong> [2]. Simple-cell-like features are more<br />
prom<strong>in</strong>ent <strong>in</strong> our results. Also, <strong>in</strong> section 4 of [9], the<br />
obta<strong>in</strong>ed quadratic forms correspond to squared simple<br />
cell outputs.<br />
5. Conclusion<br />
This paper treats nonl<strong>in</strong>ear ICA by reduc<strong>in</strong>g it to the<br />
case of l<strong>in</strong>ear ICA. After formally stat<strong>in</strong>g separability<br />
results of overdeterm<strong>in</strong>ed ICA, these results are applied<br />
to quadratic and polynomial ICA. The presented algorithm<br />
consists of l<strong>in</strong>earization and application of l<strong>in</strong>ear<br />
ICA. In order to apply PCA projection also <strong>in</strong> high dimensions,<br />
a block calculation of the covariance matrix<br />
is suggested. The algorithms are then used for artificial<br />
data sets, where they show good performance for a<br />
sufficiently high number of samples. In the application<br />
to natural image data, characteristics of the obta<strong>in</strong>ed<br />
quadratic forms are qualitatively the same as the results<br />
of Bartsch and Obermayer [2] and they correspond to<br />
squared simple cell outputs. In future work, we want<br />
to further <strong>in</strong>vestigate a possible enhancement of the<br />
separability result as well as a more detailed extension<br />
to ICA with polynomial and maybe analytic mapp<strong>in</strong>gs.<br />
Furthermore, bil<strong>in</strong>ear ICA with additional noise (for example<br />
multiplicative noise) could be considered. Also,<br />
issues such as model and parameter selection will have<br />
to be treated, if higher order models are allowed.<br />
Acknowledgments<br />
We thank the anonymous reviewers for their valuable<br />
suggestions, which improved the orig<strong>in</strong>al manuscript.<br />
FT was partially supported by the DFG <strong>in</strong> the grant


