Mathematics in Independent Component Analysis
Mathematics in Independent Component Analysis
Mathematics in Independent Component Analysis

Create successful ePaper yourself
Turn your PDF publications into a flip-book with our unique Google optimized e-Paper software.
292 Chapter 21. Proc. BIOMED 2005, pages 209-212<br />
Automated count<strong>in</strong>g of labelled cells <strong>in</strong> rodent bra<strong>in</strong> section images<br />
F.J. Theis 1 , Z. Kohl 2 , H.G. Kuhn 2 , H.G. Stockmeier 1 and E.W. Lang 1<br />
1 Institute of Biophysics, University of Regensburg, 93040 Regensburg, Germany<br />
2 Department of Neurology, University of Regensburg, 93053 Regensburg, Germany<br />
email: fabian@theis.name<br />
ABSTRACT<br />
The genesis of new cells, especially of neurons, <strong>in</strong> the adult<br />
human bra<strong>in</strong> is currently of great scientific <strong>in</strong>terest. In order<br />
to measure neurogenesis <strong>in</strong> animals new born cells are<br />
labelled with specific markers such as BrdU; <strong>in</strong> bra<strong>in</strong> sections<br />
these can later be analyzed and counted through the<br />
microscope. So far, the image analysis has been performed<br />
by hand. In this work, we present an algorithm to automatically<br />
segment the digital bra<strong>in</strong> section picture <strong>in</strong>to cell<br />
and noncell components, giv<strong>in</strong>g a count of the number of<br />
cells <strong>in</strong> the section. This is done by first tra<strong>in</strong><strong>in</strong>g a so-called<br />
cell classifier with cell and non-cell patches <strong>in</strong> a supervised<br />
manner. This cell classifier can later be used <strong>in</strong> an arbitrary<br />
number of sections by scann<strong>in</strong>g the section and choos<strong>in</strong>g<br />
maxima of this classifier as cell center locations. For tra<strong>in</strong><strong>in</strong>g,<br />
s<strong>in</strong>gle- and multi-layer perceptrons were used. In prelim<strong>in</strong>ary<br />
experiments, we get good performance of the classifier.<br />
KEY WORDS<br />
Cell count<strong>in</strong>g, image segmentation, cell classification, neurogenesis,<br />
BrdU<br />
1 Biological background<br />
1.1 New neurons <strong>in</strong> the adult bra<strong>in</strong><br />
Dur<strong>in</strong>g the last decades the fact that new neurons are cont<strong>in</strong>uously<br />
generated <strong>in</strong> the adult mammalian bra<strong>in</strong> - a phenomenon<br />
termed adult neurogenesis - came more and more<br />
<strong>in</strong>to focus of neuroscience research [1][2][7]. Under physiological<br />
conditions, neuroscientists found, that adult neurogenesis<br />
seems to be restricted to two bra<strong>in</strong> regions: The<br />
wall of the lateral ventricle and the granular cell layer of<br />
the hippocampus.<br />
A large variety of factors <strong>in</strong>clud<strong>in</strong>g environmental<br />
signals, trophic factors, hormone and neurotransmitters<br />
have recently been identified to regulate the generation of<br />
new neurons <strong>in</strong> the adult bra<strong>in</strong>. These studies were typically<br />
performed by us<strong>in</strong>g a comb<strong>in</strong>ation of different histological<br />
techniques, such as non-radioactive label<strong>in</strong>g of<br />
newly generated cells, stereological count<strong>in</strong>g and confocal<br />
microscope analysis, <strong>in</strong> order to quantitatively analyze<br />
adult neurogenesis (review <strong>in</strong> [8]). However, this procedure<br />
is time consum<strong>in</strong>g, s<strong>in</strong>ce histological analysis currently depends<br />
on assessment of positive signals <strong>in</strong> histological sec-<br />
tions by <strong>in</strong>dividual <strong>in</strong>vestigators through manual or semiautomatic<br />
count<strong>in</strong>g.<br />
1.2 Method used<br />
Bromodeoxyurid<strong>in</strong>e (BrdU), a thymid<strong>in</strong>e analog is given<br />
systemically and is <strong>in</strong>tegrated <strong>in</strong>to the replicat<strong>in</strong>g DNA dur<strong>in</strong>g<br />
cell division [3]. Us<strong>in</strong>g a specific antibody aga<strong>in</strong>st<br />
BrdU, labelled cells can be detected by an immunohistochemical<br />
sta<strong>in</strong><strong>in</strong>g procedure. The nuclei of labelled cells<br />
on 40µm thick bra<strong>in</strong> sections appear <strong>in</strong> dark brown or<br />
black dense color. To determ<strong>in</strong>e the amount of BrdUpositive<br />
cells <strong>in</strong> the granular cell layer of the hippocampus<br />
they were counted on a light microscope (Olympus IX<br />
70; Hamburg, Germany) with a 20× objective. Digital images<br />
with a resolution of 1600 × 1200 pixels were taken by<br />
a color video camera us<strong>in</strong>g the analySIS-software system<br />
(Soft Imag<strong>in</strong>g System, Münster, Germany).<br />
2 Automated count<strong>in</strong>g<br />
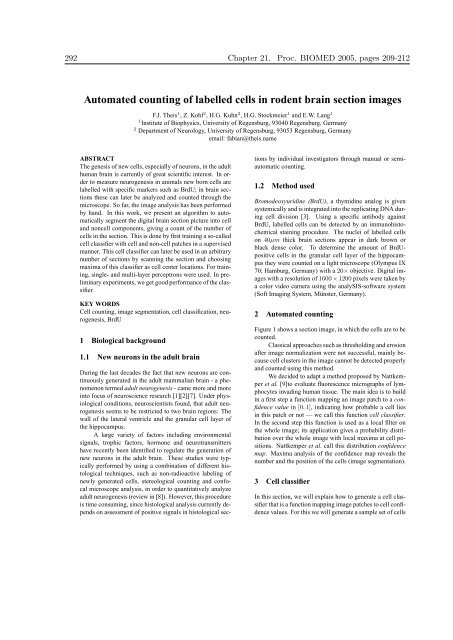
Figure 1 shows a section image, <strong>in</strong> which the cells are to be<br />
counted.<br />
Classical approaches such as threshold<strong>in</strong>g and erosion<br />
after image normalization were not successful, ma<strong>in</strong>ly because<br />
cell clusters <strong>in</strong> the image cannot be detected properly<br />
and counted us<strong>in</strong>g this method.<br />
We decided to adapt a method proposed by Nattkemper<br />
et al. [9]to evaluate fluorescence micrographs of lymphocytes<br />
<strong>in</strong>vad<strong>in</strong>g human tissue. The ma<strong>in</strong> idea is to build<br />
<strong>in</strong> a first step a function mapp<strong>in</strong>g an image patch to a confidence<br />
value <strong>in</strong> [0, 1], <strong>in</strong>dicat<strong>in</strong>g how probable a cell lies<br />
<strong>in</strong> this patch or not — we call this function cell classifier.<br />
In the second step this function is used as a local filter on<br />
the whole image; its application gives a probability distribution<br />
over the whole image with local maxima at cell positions.<br />
Nattkemper et al. call this distribution confidence<br />
map. Maxima analysis of the confidence map reveals the<br />
number and the position of the cells (image segmentation).<br />
3 Cell classifier<br />
In this section, we will expla<strong>in</strong> how to generate a cell classifier<br />
that is a function mapp<strong>in</strong>g image patches to cell confidence<br />
values. For this we will generate a sample set of cells