Mathematics in Independent Component Analysis
Mathematics in Independent Component Analysis
Mathematics in Independent Component Analysis

Create successful ePaper yourself
Turn your PDF publications into a flip-book with our unique Google optimized e-Paper software.
16 Chapter 1. Statistical mach<strong>in</strong>e learn<strong>in</strong>g of biomedical data<br />
In contrast to this sometimes called hard-whiten<strong>in</strong>g technique, soft-whiten<strong>in</strong>g tries to avoid<br />
a bias towards second-order statistics and uses a non-orthogonal jo<strong>in</strong>t diagonalization algorithm<br />
(Pham, 2001, Yeredor, 2002, Ziehe et al., 2003b) by jo<strong>in</strong>tly diagonaliz<strong>in</strong>g the source conditions<br />
Ci(x) together with the mixture covariance matrix E(xx ⊤ ). Then possible estimation errors <strong>in</strong><br />
the second-order part do not <strong>in</strong>fluence the total error disproportionately high.<br />
Depend<strong>in</strong>g on the source conditions, various algorithms have been proposed <strong>in</strong> the literature.<br />
Table 1.1 gives an overview over the algorithms together with the references, the source model,<br />
the condition matrices and the optimization algorithm. For more details and references, we refer<br />
to Theis and Inouye (2006).<br />
Multidimensional autodecorrelation<br />
In Theis et al. (2004e), see chapter 6, we considered BSS algorithms based on time-decorrelation<br />
and the result<strong>in</strong>g source condition. Correspond<strong>in</strong>g JD-based algorithms <strong>in</strong>clude AMUSE (Tong<br />
et al., 1991) and extensions such as SOBI (Belouchrani et al., 1997) and TDSEP (Ziehe and<br />
Mueller, 1998). They rely on the fact that the data sets have non-trivial autocorrelations. We<br />
extended them to data sets hav<strong>in</strong>g more than one direction <strong>in</strong> the parametrization such as<br />
images. For this, we replaced one-dimensional autocovariances by multidimensional autocovariances<br />
def<strong>in</strong>ed by<br />
�<br />
Cτ1,...,τM (s) := E s(z1 + τ1, . . . , zM + τM)s(z1, . . . , zM) ⊤�<br />
(1.7)<br />
where the s is centered and the expectation is taken over (z1, . . . , zM). Cτ1,...,τM (s) can be<br />
estimated given equidistant samples by replac<strong>in</strong>g random variables by sample values and expectations<br />
by sums as usual.<br />
A typical example for non-trivial multidimensional autocovariances is a source data set, <strong>in</strong><br />
which each component si represents an image of size h × w. Then the data is of dimension<br />
M = 2 and samples of s are given at <strong>in</strong>dices z1 = 1, . . . , h, z2 = 1, . . . , w. Classically, s(z1, z2)<br />
is transformed to s(t) by fix<strong>in</strong>g a mapp<strong>in</strong>g from the two-dimensional parameter set to the onedimensional<br />
time parametrization of s(t), for example by concatenat<strong>in</strong>g columns or rows <strong>in</strong> the<br />
case of a f<strong>in</strong>ite number of samples (vectorization). If the time structure of s(t) is not used, as <strong>in</strong><br />
all classical ICA algorithms <strong>in</strong> which i.i.d. samples are assumed, this choice does not <strong>in</strong>fluence<br />
the result. However, <strong>in</strong> time-structure based algorithms such as AMUSE and SOBI results can<br />
vary greatly depend<strong>in</strong>g on the choice of this mapp<strong>in</strong>g.<br />
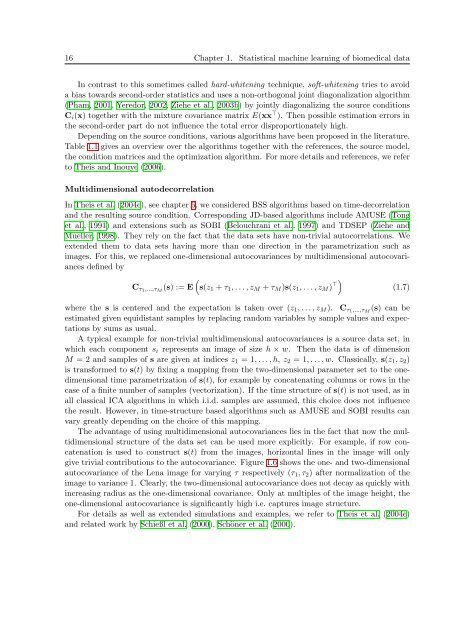
The advantage of us<strong>in</strong>g multidimensional autocovariances lies <strong>in</strong> the fact that now the multidimensional<br />
structure of the data set can be used more explicitly. For example, if row concatenation<br />
is used to construct s(t) from the images, horizontal l<strong>in</strong>es <strong>in</strong> the image will only<br />
give trivial contributions to the autocovariance. Figure 1.6 shows the one- and two-dimensional<br />
autocovariance of the Lena image for vary<strong>in</strong>g τ respectively (τ1, τ2) after normalization of the<br />
image to variance 1. Clearly, the two-dimensional autocovariance does not decay as quickly with<br />
<strong>in</strong>creas<strong>in</strong>g radius as the one-dimensional covariance. Only at multiples of the image height, the<br />
one-dimensional autocovariance is significantly high i.e. captures image structure.<br />
For details as well as extended simulations and examples, we refer to Theis et al. (2004e)<br />
and related work by Schießl et al. (2000), Schöner et al. (2000).